
33 | A Demographic Portrait of India through 1931 Census
Updated: Aug 25
By Gaurav Kalyani and Shivakumar Jolad
Published on: 25 August 2026
Introduction
The census taken on the night of 26 February 1931 was the sixth general census of India and the last to be reported in full. The enumeration of 1941 was curtailed by war and only partially tabulated, so the twenty-eight volumes prepared under J. H. Hutton remain the fullest demographic account of undivided India.
It returned a population of 352,837,778 for an area of 1,808,679 square miles. G. Findlay Shirras, reviewing the results in the Geographical Review in 1935, quoted Herodotus from Hutton’s report, “Of all the nations that we know it is India has the largest population.” On Willcox’s revised estimate for China the claim was true again in 1931, and India held close to a fifth of the world’s inhabitants (Shirras, 1935).
This essay delves deeper into the demographic findings of this 1931 census. The report by Hutton is forthright about the quality of its own figures. The decade it covered was exceptionally free of major natural catastrophes like the earlier decades, which made it a good mirror of what the population did when nothing went badly wrong.
Distribution and movement of population
British India proper held 256,859,787 people on 862,679 square miles and the Princely States 81,310,845 on 712,508. The mean density was 195 persons to the square mile, which Hutton thought was a reliable figure.
Density ran from 6.5 in Baluchistan to 814.2 in Cochin State, one rural unit there carrying 4,090 persons to the square mile, while in Bengal the Dacca Division averaged 935. Areas with lower rainfall, such as the Punjab, successfully boosted their population density through massive canal irrigation projects like the Sutlej Valley project. In comparison, England and Wales stood at 685, Europe as a whole at 127 and the United States at 41.
Table. The population of India at six censuses
Census year | Population | Increase | Growth |
1881 | 253,896,330 | — | — |
1891 | 287,314,671 | +33,418,341 | +13.16% |
1901 | 294,361,056 | +7,046,385 | +2.45% |
1911 | 315,156,396 | +20,795,340 | +7.06% |
1921 | 318,942,480 | +3,786,084 | +1.20% |
1931 | 352,837,778 | +33,895,298 | +10.63% |
NET 1881–1931 | — | +98,941,448 | +39.0% |
Increases include population added by new areas and improved methods; over the fifty years 1881–1931 the total rose 39 percent.

The increase of 33,895,298 since 1921 was the largest real rate of any of the five decades,
and Hutton’s explanation was that the decade was quiet. There was no serious famine; cholera and plague took much less than their usual toll. Kala-azar, whose antimony treatment had once taken three months to apply, could now be cured in ten days. Harvests were good, irrigation and hydro-electric schemes were completed, and co-operative societies had more than doubled.

The contrast with the preceding decade is notable. Between 1911 and 1921 the population rose 1.2 percent, because the influenza epidemic of 1918 wiped out most of the natural population growth.

Shirras noted that it was higher than the total plague deaths of the previous twenty years, and more than double the deaths attributable to the famines of 1897–1901. Some 125 million were affected, and the birth rate fell below the death rate in 1918 and 1919.
The 1931 figures therefore show what an Indian population did in the absence of that kind of shock. A lower birth rate was noted among Hindus compared to Muslims, which is attributed to social customs like purdah and the discouragement of widow remarriage.
Density followed rainfall closely, but the fastest growth was not where population was thickest. In Travancore the fertile lowlands grew 24.2 percent and the least fertile highlands 54.7. Hutton observed that in areas that are already crowded, there is a noticeable movement of people onto less profitable land.
Hutton departed from his statistics at the end of the report’s first chapter. The decade’s increase alone approached the total population of France (41.5 million) or Italy (41.2 million). He measures it against literacy. The literate population was 22,633,651 in 1921 and 28,131,315 in 1931, so the increase in population exceeded the entire literate population of 1921 by half.
In Travancore, by far the most literate area, the proportion of literates fell from 24.2 to 23.6 percent while the population grew 27 percent. He was sceptical of the food-shortage argument then made by Wattal and Ranadive, pointing to collapsing food prices, and located the difficulty elsewhere.
Hutton concluded the number who can work a given area economically was limited, so growth must produce either uneconomic subdivision of holdings or a floating population with nothing to exchange for food.
Birth control was what Indian economists generally proposed as the remedy, and Hutton noted that the movement was “perhaps less hampered by misplaced prudery than in some countries which claim to be more civilized”.
An appendix written by Bengal Census Superintendent A. E. Porter compared traditional Malthusian checks against Raymond Pearl's S-shaped "logistic curve" to predict Bengal's future population growth. Porter's mathematical equations predicted a 1941 population for Bengal of 53 to 53.5 million.
Over this fifty-year period, population growth across India was highly uneven, with southern and princely regions like the Madras States Agency (+101.9%) and Mysore (+56.6%), alongside Assam (+79.2%), expanding far ahead of the 39.0% national average. Assam's rapid growth was heavily driven by in-migration to its tea gardens.

Meanwhile, the United Provinces (+10.6%)—the most populous region with 48.4 million people—and Rajputana (+11.1%) experienced near-stagnation, signaling a major shift in the subcontinent's demographic center of gravity away from the upper Gangetic plain.
States Vs British Provinces
India in 1931 was administratively two countries. The Indian States and Agencies grew faster than British India over the period as a whole, lifting their share of the total population from 21.8 to 23.0 per cent. Their demographic behaviour over the fifty years was not identical.

The States were the more volatile of the two blocs. They grew faster than British India in four decades out of five, but they also suffered the only outright decline in the series, losing 5.0 per cent of their population in the 1890s while British India gained 4.7 per cent. That decade was dominated by famine, and the princely states, many of them in the drier interior of the subcontinent, in Rajputana and Central India, were more exposed to it.
The influenza decade was the one period when the two blocs behaved identically, growing 1.25 and 1.02 per cent respectively. The epidemic did not respect administrative boundaries in the way a famine, mediated by local agriculture and relief policy, evidently could.

Indexed to 1881, the divergence was clear. By 1931 the Indian States stood at 147 against 137 for the Provinces. Although their population share rose, it was a modest shift in proportional terms. One representing several million people, and it ran counter to the usual assumption that the dynamism of the period lay in British-administered territory.
Density
Density varied more than any other measure in the census. Delhi, effectively a city-province, recorded 1,110 persons per square mile. Bengal, the most densely settled large territory, recorded 646 across a province of 50.1 million people, more than three times the national average. At the other extreme the Baluchistan States held 5 persons per square mile and the Andaman and Nicobar Islands 9. The ratio between the densest and sparsest units exceeds 200 to 1.
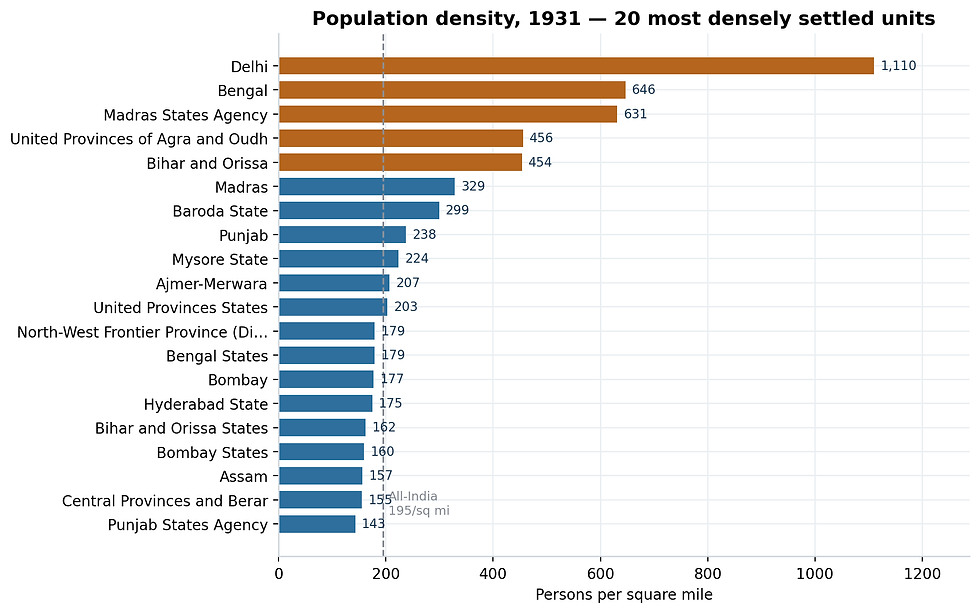
Density in this period was largely a proxy for agricultural productivity, and specifically for the availability of water. The dense belt ran along the Gangetic plain and the deltas, areas like Bengal, the United Provinces, Bihar and Orissa, the Madras States Agency along the Malabar coast. Meanwhile the sparse units were the arid west and the mountainous north.
Urban and rural populations
Out of the total population of 352,837,778 distributed across 699,406 places, 89.0% (313,852,351 people) lived in 696,831 rural areas. Conversely, only 11.0% (38,985,427 people) resided in the 2,575 designated urban areas. Among these urban environments, the population was distributed across various town sizes, led by 38 major cities.
Hutton conceded that the town was a partly arbitrary category. Municipalities, civil lines and cantonments were urban automatically; beyond these, superintendents could classify any collection of 5,000 or more people at discretion Nearly 600 of the 2,575 towns were so classified.
Many non-industrial towns, the Bengal superintendent noted, “differ but little in their conditions from large villages, except in the provision of an infrequent lamppost.” On this definition 38,985,427 people, or 11 percent, were urban.
Urban population grew 20 percent against 10 percent for rural and towns absorbed 19.2 percent of the total increase, but the base was small enough that the total and rural curves are almost indistinguishable.
Provincial variation ran from 3.4 percent urban in Assam to 22.6 in Bombay. Against Bombay, the most urbanised major province, the figures were 49 percent for France, 56.2 for the United States and 80 for England and Wales.
Table. Distribution of the population between towns and villages
Class of place | Places, 1931 | Population, 1931 | Per mille of total | Percentage (%) |
Towns of 100,000 and over | 38 | 9,674,032 | 27 | 2.7 |
50,000 to 100,000 | 65 | 4,572,113 | 13 | 1.3 |
20,000 to 50,000 | 268 | 8,091,288 | 23 | 2.3 |
10,000 to 20,000 | 543 | 7,449,402 | 21 | 2.1 |
5,000 to 10,000 | 987 | 6,992,832 | 20 | 2.0 |
Under 5,000, classified urban | 674 | 2,205,760 | 6 | 0.6 |
All urban areas | 2,575 | 38,985,427 | 110 | 11.0 |
Rural areas | 696,831 | 313,852,351 | 890 | 89.0 |
Growth was fastest in the 20,000–50,000 class, whose population is now nearly double that of the 50,000–100,000 class. Hutton's text elsewhere gives 39 cities of 100,000 and over.
Nearly 89 percent of the population was rural; more than half lived in villages of under 1,000 and 27.6 percent in villages of under 500. Hutton dismissed the racial explanation for low urbanisation offered in 1901 and proposed rainfall instead.
By 1931, 39 towns had over 100,000 residents, led by Calcutta (1.48 million) and Bombay (1.16 million), followed by a steep drop to Madras, Hyderabad, and Delhi. Calcutta was characterized by intense congestion and a massive floating population, while Bombay suffered a depressed growth rate of 16% due to the civil disobedience movement and the economic depression.
Bombay also faced severe congestion, with the Kumbharwada ward reaching a density of 465,280 people per square mile and the vast majority of residents confined to one-room tenements. Due to these severe conditions, Census Commissioner J. H. Hutton remarked that the 1.2% decline in Bombay's population since 1921 was a positive development for both the city itself and the residents who had moved away.

The ranking of the ten largest cities highlights a stark divide in gender distribution. The urban sex ratio was heavily skewed, with 815 females per 1,000 males in urban areas compared to 957 in rural areas. Because men typically left their families behind in their home villages when migrating for work, urban areas had a significantly lower proportion of women than rural areas.
Despite the ambiguous definition of a ‘house’, historical census trends showed a gradual decline in average household size (from 5.8 persons per house in 1881 to 4.9 in 1931) alongside an increase in houses per square mile (from 31.7 to 39.3).
Urban spaces faced the problem of severe overcrowding, far exceeding the slums of Britain. The absolute peak density was recorded in the Chak No. 95 ward of Cawnpore at 786,500 persons per square mile.
The newly built industrial town of Jamshedpur stood out as a contrast. Developed by the Tata steelworks, it featured planned housing, sewers, water supply, and schools, proving that overcrowding was a failure of administration rather than an inevitability of Indian city life.
Despite this overcrowding issue, India's high-density areas were characterized by crowded rural settlements rather than urban concentration, as heavily populated regions like Bengal and Bihar had very low urbanization rates.

Despite vast regional variations in density, wealth, and culture, the national average household size remained remarkably stable at 4.97 persons per house, rarely fluctuating outside the range of 4.3 to 5.5 in any unit.

Ultimately, while city life was an economic necessity for some, India’s core settlement pattern remained firmly rooted in the village. 1931 therefore captures India at an inflection point. The demographic drag of epidemic mortality had lifted, and the population was expanding faster than at any earlier point in the series. What it had not yet done was urbanise. India in 1931 was a society growing quickly and still overwhelmingly rural.
Birth-place and Movement of population
Of the whole population enumerated by birth-place, fewer than a million had been born outside the province or state where they were counted. Hutton noted a caution that the smaller the unit the larger the proportion born elsewhere, so India’s low figure is partly an artefact of size.
Shirras (1935) added the social reasons. He noted a Hindu who leaves permanently is cut off from the part of his caste with which he may eat, smoke and intermarry, and more prosaically “he is bound to the soil he cultivates.”
The report classified movement as casual, temporary, periodic, semi-permanent and permanent and added a new category for 1931: daily movement. It reported some 26,000 season-ticket holders entered Calcutta each day.
The report acknowledged that India's agricultural dominance kept overall migration rates low, but stressed that population movement was highly concentrated in specific areas. Urban centers like Delhi and Ajmer, along with plantation regions like Assam and Coorg, recorded exceptionally high percentages of immigrants, while provinces like Bihar and Orissa and Burma acted as major exporters of labor.
A sharp divide was revealed between territories that gained population and those that lost it. Assam, Bengal, and Bombay emerged as the largest net gainers, drawing in hundreds of thousands of laborers and regional migrants.
In contrast, Bihar and Orissa, the United Provinces, and Madras suffered the heaviest net losses, with Bihar's emigration remaining largely temporary while the United Provinces shifted toward longer-term, semi-permanent arrangements.
Daily travel for employment became a prominent feature in industrial and administrative centers like Bombay, Nagpur, Delhi, and various towns in Travancore. Workers relied on trains, buses, and local transport to travel short distances for work, representing a small-scale but rapidly expanding demographic phenomenon.

The report also documented a major shift where the Princely States became net gainers of population from British India, reversing the trends observed in 1911 and 1921. While Mysore led these gains, states like Rajputana remained heavy net exporters of people to British territories.
Externally, 730,546 persons of foreign birth were enumerated in India against roughly 2,404,000 Indians resident overseas, a net balance of about 1.75 million against India.
The largest communities were in Ceylon (778,170, of whom 95 percent were Tamils) and Malaya (624,009). Emigration of unskilled labour had been controlled since 1922 and had effectively ceased outside those two. The Emigration Act of 1922 effectively ended unskilled indentured labor migration to distant colonies like Fiji, Trinidad, and Surinam.
Public outcry led by leaders like Pandit Madan Mohan Malaviya and Mahatma Gandhi forced the British government to end new indentured recruitment by 1917. The Indian Emigration Act of 1922 repealed earlier colonial acts and prohibited the system of indentured labor entirely. The 1922 law set up formal procedures to protect unskilled workers going abroad, ensuring emigration only occurred under clearly specified and approved terms (BBC, n.d.).
The 1920s marked a transition away from bound, multi-year plantation contracts toward regulated, assisted, or independent contractual migration. The government sought to control labor agents and prevent the severe exploitative characteristic of the 19th-century "coolie" contracts. The structures initiated in the 1920s eventually paved the way for modern emigration frameworks, culminating later in the Emigration Act of 1983 to safeguard overseas Indian workers (BBC, n.d.).
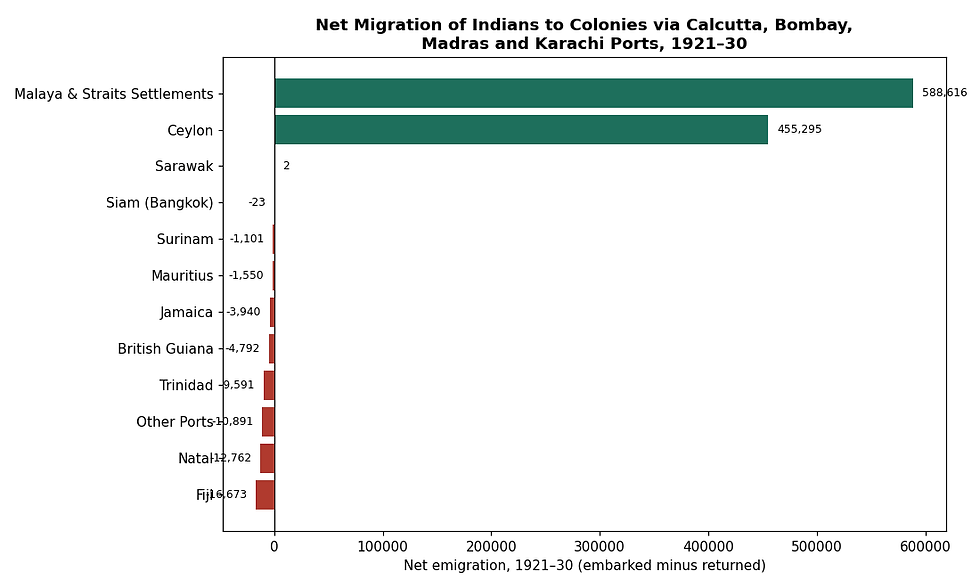
Interestingly, the census observed weakening of caste rigidity and the adaptation of social customs among the diaspora, highlighting the transformative power of migration, even as millions of overseas Indians maintained a deep, enduring connection to their cultural roots.
Age, mortality and the Actuarial report
Hutton conceded that “the Indian age returns are admitted on all hands to be extremely inaccurate,” and his reasons were specific. Ages of girls between 10 and 15 were consistently deficient, partly because upper-caste Hindus were unwilling to admit to unmarried pubescent daughters. Other reasons included elderly widowers understating their ages if they wish to remarry.
The distribution was that of a young and growing population. Nearly 40 percent were under 15 and 8.8 percent aged 50 and over. In Sundbärg's classification, every province and religious community was progressive except the Parsis. The mean age was 23.2 for males and 22.8 for females, against 30.6 in England and Wales in 1921. An increase in children under five was attributed to the prosperity of the decade, and a depressed 5–10 group reflected the effect of influenza from the previous one.

Vital statistics were worse still. The village headman had every incentive to delay reporting a birth until he saw whether the child lived, and to hesitate over deaths that might attract police attention. Hutton estimated the general defect at about 20 percent.
Infant mortality had nevertheless improved (see the infant mortality comparison chart in the appendix). In British India the rate per 1,000 live births fell from about 205 in 1911 and 267 in the influenza year of 1918 to 181 in 1930. City rates remained far higher with Bombay 298 and Calcutta 268.
A Madras enquiry into 7,324 maternal deaths found mortality highest in first confinements and at the earliest ages, and only about a third of confinements attended by skilled medical aid. Maternal mortality there in 1927 was put at some 20 per 1,000 live births against 2.6 in the Netherlands. The Age of Consent Committee’s comparison, which Hutton quoted, was revealing:
“Satis were few and far between … In the case of early maternity the evil is widespread … so extensive as to affect the whole framework of society. After going through the ordeal, if a woman survives to the age of 30 she is in many cases an old woman, almost a shadow of her former self … In the case of sati the utter hideousness of the incident shocked the conscience; in this case the familiarity of the evil blinds us to its ghastly results.”
Hutton’s conclusion follows from it: “What is really wanted is fewer babies but better ones,” with effort concentrated less on infant welfare directly than on reducing immature maternity.
Sir John Megaw put it that 100 of every 1,000 girl wives were “doomed to die in child-birth before they have ceased to have babies.”
The Actuarial Annexure, prepared by Actuary L. S. Vaidyanathan, explains the complex mathematical models used to construct province-by-province life tables from highly flawed raw census and vital statistics data. These pages of precise, multi-figure calculations provided vital localized insights into age-specific survival and death rates, underpinning the broader longevity figures.

Another short appendix contributed by W. H. Shoobert steps entirely outside statistics to tell the story of Siddi Wastad, an aged retainer of African descent living in Nagpur. Locally, he was believed to have lived over a hundred years and probably was the oldest man in the province.
Siddi Wastad had reportedly travelled with a wrestler-employer to Lahore by road and rail in his working years, survived a mauling by a wild boar in his prime, and by the time of the Report's writing was still living. He was remarkably alert, keeping to a plain diet and largely refusing medicine, once even chasing off an armed attacker in his old age by force of habit alone. His exceptional longevity and vivid life story serve as a reminder that behind every dry demographic average were real, singular human lives.
Sex ratios and Fertility
Hutton expressed anxiety over a declining national sex ratio that had been slipping steadily since 1901. India returned 940 females per 1,000 males, continuing a fall under way since 1901. He noted,
“The female infant is definitely better equipped by nature for survival than the male, but in India the advantage she has at birth is probably neutralised in infancy by comparative neglect and in adolescence by the strain of bearing children too early and too often.”
Although he found no evidence of widespread female infanticide, the practice was still present in remote areas. He also recorded that “so strong indeed is the prejudice against the birth of daughters that abortion is reported to be sometimes practised if the child in the womb is foretold to be a girl.”
A steep gradient of female-to-male ratios was recorded running north-west to south-east. In the north-west, Baluchistan and Delhi recorded approximately 720 females per 1,000 males, Sind recorded 790, and Punjab recorded 830. In contrast, the Central Provinces and Madras recorded higher proportions of females, at approximately 1,010 and 1,030 per 1,000 males, respectively.
The lowest ratios were found within specific clans; the Kachwaha Rajputs of Jaipur recorded 584 females per 1,000 males, while their Shekhawat branch recorded 530. The Census Superintendent for Rajputana attributed these low figures to economic challenges, noting that poverty made the payment of substantial dowries difficult, and families faced social anxiety regarding unmarried daughters. According to him, these pressures led to a systematic neglect of female infants, resulting in the low recorded ratio.
Table: Females per 1,000 males, all ages and at the reproductive ages
Community | All ages | At the reproductive ages |
Christian | 952 | 1,080 |
Tribal religions | 1,009 | 1,143 |
Muslim | 901 | 1,026 |
Hindu | 951 | 897 (after excluding widows) |
Jain | 941 | 810 (after excluding widows) |
Sikh | — | 848 |
All India | 940 | — |
Reproductive ages are females 15–45 against males 20–50. Before excluding widows the Hindu figure is 1,059. Sikhs returned the lowest all-ages ratio of any community (799 per 1,000 in the Punjab); the Christian and tribal figures are affected by conversion into and out of those communities.
Female representation increased inversely with social status, with depressed classes showing significantly higher female-to-male ratios than advanced castes. Tribal populations consistently recorded more women than men, which the report attributes to the absence of dowry-related neglect.
Conversely, communities like the Sikhs recorded very low ratios, while the matrilineal Nayars of Cochin and Madras stood out with exceptionally high female ratios. Regional differences were also heavily influenced by labor migration.

Hindus show 1,059 females per 1,000 males of reproductive age. But 8,313,773 of those women were widows, and since remarriage was effectively barred the corrected figure was 897. Jains fell to 810. Muslims, whose ratio for the whole population was only 901, show 1,026 at the reproductive ages, and Christians 1,080.
The report illustrated a sharp dip in female survival during adolescence, when early marriage and frequent childbearing took a heavy toll on young women. This demographic trend was supported by findings from the Age of Consent Committee, which linked early consummation to high rates of fatal respiratory and ovarian illnesses among young wives.
Drawing on a special sample of roughly 900,000 families, the census found a normal biological ratio for first-born children. The data showed that marrying under the age of twelve resulted in the poorest child survival rates, whereas families where the wife married between twenty and twenty-five saw both the largest average family size and the highest child survival rates.
The Cochin commissioner attributes his state’s rise of sex ratio to “a steady rise in the age of marriage consequent on the rapid progress of female education” and to modern midwifery. Hutton concludes with a call for raising the marriage age of women, arguing that doing so would not necessarily reduce total births but would significantly improve the survival rate of the children born.
Civil condition: Marriage and Widowhood
This section of the report was unique because it was written in the shadow of the recently passed Child Marriage Restraint Act of 1930, also known as the Sarda Act, allowing enumerators to observe and measure the immediate, unintended consequences of the law.
In every previous census married women outnumbered married men, however in 1931 the position reversed, leaving over 600,000 more married men with no wives. Hutton concluded that “at the very least 1,046,747 married females have been returned as unmarried, and that all these are under the age of 14 years.

The intensity of early and universal marriage practices also varied significantly by religion, with Jains and Hindus exhibiting the highest marriage ratios, followed by Sikhs and Muslims, while Christians and tribal populations recorded much lower rates.
The report notes that "marriage" in India carried a very different meaning than in Europe, as it did not necessarily imply cohabitation. Ceremonial marriage and actual cohabitation were often separated by several years, yet the ceremony itself remained complete and legally binding even if the groom died before cohabitation began.
Consequently, the 1931 statistics show remarkable rates of childhood marriage, with dozens of infants per thousand under five years old, and a substantial proportion of children under fifteen, already returned as married, particularly across northern and central India.

The passage of the Sarda Act, which was designed to curb child marriage by penalizing marriages of girls under fourteen and boys under eighteen, had a highly counterproductive immediate impact due to a six-month delay in its enforcement.
In Bakarganj the monthly average of registered minor marriages from 1921 to 1929 was 305. In January to April 1930 the numbers were 419, 1,320, 8,782 and 4,452. Specific unions recorded include a bridegroom of two years to a bride of twenty-one days.
Conservative groups utilized this grace period to conduct a massive, hurried wave of infant marriages before the law took effect. The report describes a frenzy of weddings across regions like Gujarat and Bengal, where girls as young as three were married off, sometimes to elderly or diseased grooms, in a desperate scramble to beat the legislative deadline.
Table: Civil condition, corrected, per cent of each sex
Population | Sex | Unmarried | Married | Widowed |
India (with Burma) | Males | 47.9 | 46.7 | 5.4 |
| Females | 35.2 | 49.3 | 15.5 |
India (excluding Burma) | Males | 47.6 | 47.0 | 5.4 |
| Females | 33.8 | 50.6 | 15.7 |
Burma | Females | 52.1 | 37.4 | 10.6 |
Northern Ireland, 1926 | Males | 64.4 | 31.5 | 4.1 |
| Females | 61.1 | 30.6 | 8.4 |
Burmese women, among whom prepuberty marriage was not practised, are the useful internal control; Northern Ireland is the external comparison Hutton uses. Figures incorporate his adjustment for concealed marriages..
The resulting picture of female life is stark and, allowing for concealment, probably understated. Little more than one percent of surviving females escaped marriage, against about 26 percent in Northern Ireland. By 15, nearly 40 percent had been married and one in a hundred was already a widow. By 20, some 85 percent had been married against 45 percent of males; by 30, nearly 98 percent had been married and more than a tenth widowed.
Because young girls were frequently wedded to much older men, many faced a lifetime of social exclusion after their husbands passed away. The overall proportion of widows had in fact improved, from 175 per 1,000 females in 1921 to 155 in 1931. Hutton attributed this improvement to the absence of famine and pestilence.
Individual provinces and princely states attempted various legal reforms to address these social challenges, such as Baroda's efforts to facilitate widow remarriage. The report also discussed reformist efforts to ease inter-caste marriages and to outlaw the dedication of young girls to temples under the devadasi system.
In an ethnographic appendix, A. C. Turner documents the highly localized marriage customs of the United Provinces, illustrating the cultural diversity that national statistics often obscure. His observations detail practices such as ghar-jawai, where a poor husband resided with his wife's family despite social disdain, and ghar-baithwa, where a widow installed a new husband in her home.
He also notes the survival of polyandry in the hills of Dehra Dun, easy divorce customs, and the widespread practice of exchanging daughters between families to avoid expensive dowries.
The 1931 census captured a critical transitional moment characterized by intense friction between traditional custom and modern legal reform.
Infirmities
Enumerators were asked to record four conditions: insanity, deaf-mutism, blindness of both eyes, and corrosive leprosy. Hutton does not defend the exercise, as in England and Wales it was already abandoned a decade earlier.
The 1931 census recorded 1,095,678 persons as afflicted against 860,099 in 1921. Of which, 120,304 were insane, 230,895 were deaf-mute, 601,370 were blind and 147,911 were lepers. Comparisons with independent medical surveys revealed that the census captured only about one-tenth of actual leprosy cases.

Insanity was considered the least reliably recorded of the four core infirmities. While the overall rate stood at 34 per 100,000, wild swings in provincial districts pointed to changing local diligence rather than actual epidemiology.
Families were particularly unlikely to admit insanity in females or children, but recorded female insanity showed a distinct secondary peak in early adulthood that the report linked to the physical and social stresses of early marriage and childbirth.
The age patterns were distinct. Deaf-mutism afflicted the young, its geography correlated with steeply drained valleys and tarai country. It was consistent with iodine deficiency and its known association with goitre.
Blindness is severest in old age; its returns were held the most reliable of the four, though a count in Bijapur found 260 totally blind per 100,000 against 70 returned in 1911.
Public health authorities noted that much of India's blindness occurred in early childhood due to preventable causes like malnutrition, vitamin A deficiency (keratomalacia), smallpox, and improper medical remedies, prompting organizations like the Blind Relief Association to expand rural treatments.
Leprosy was the least trusted of all the recorded infirmities due to massive, deliberate concealment driven by social stigma and fear of isolation. Special surveys across various provinces and princely states revealed that actual leprosy rates were often eight to nearly seventy times higher than what was captured by ordinary census enumerators, showing that the official figures represented only about one-tenth of the true disease burden.
Beyond the primary infirmities, the report highlights elephantiasis, a filarial infection that was also frequently concealed due to its disfiguring effects. It also noted that general fevers—including the devastating kala-azar—accounted for more than half of all recorded deaths in British India, while tuberculosis, smallpox, and cholera remained significant public health concerns.

A retrospective comparison of census data from 1881 to 1931 revealed that recorded infirmities peaked in 1881, hit their lowest point in 1901, and rose gradually thereafter. Rather than representing true changes in disease prevalence, these shifts reflected changes in enumeration standards and the high mortality rates during major famines.
Note on the full findings of the report: The topics concerning social statistics such as Occupations, Literacy, Religion, Languages and Caste will be covered in the forthcoming separate essays in the Censusnama series.
What the census showed
Taken together, these findings show a population that grew faster between 1921 and 1931 than in any decade for fifty years.
There emerges a consistent theme across the findings, and it is a diagnosis about women. The shortage of females, the low age of marriage, the high maternal and infant mortality, the failure of female vitality to recover when male vitality did, and the mass of young widows were treated as one connected problem rather than five, with early and repeated childbearing at its center.
(Authors: Gaurav Kalyani works as Research Associate at the Center for Legislative Education and Research, FLAME University, Pune;
Shivakumar Jolad works as Associate Professor (Public Policy), and is the Chair of Center for Legislative Education and Research and Director India State Stories, FLAME University, Pune
Gaurav contributed to conceptualization and did research and primary writing; Shivakumar contributed to conceptualization, research and editing)
Sources:
BBC. (n.d.). Indian migration and Indentured labour. The British Empire series, Bitesize. https://www.bbc.co.uk/bitesize/articles/ztwyvwx#z737m39
Hutton, J. H. (1933a). Census of India, 1931. Vol. I, India, Part I: Report. Manager of Publications.
Hutton, J. H. (1933b). Census of India, 1931. Vol. I, India, Part II: Tables. Manager of Publications.
Shirras, G. F. (1935). The census of India, 1931. Geographical Review, 25(3), 434–448. https://www.jstor.org/stable/209312
Appendix


Comments