
29 | Death in Spanish Flu Pandemic: Mortality and Population decline in 1921 Census Report.
Updated: Aug 13
By Nandhini Somasundaram, Siddhart Ramkumar, Gaurav Kalyani, and Shivakumar Jolad
Published on: 12 Aug 2026
Introduction
When J. T. Marten presented the results of the 1921 Census of India, the figure that stood out was that the population had grown by only about 1.2 percent over the decade, a rate far below the momentum of 1901–1911. The census documents a decade of two halves: seven years of steady growth, followed by the largest single health disaster in the recorded history of the subcontinent.
The influenza epidemic that began in the latter part of 1918 visited almost every portion of the country and wiped out in a few months practically the whole natural increase in the population for the previous seven years. It overshadowed every other public health factor of the period, including the plague and cholera outbreaks that ran alongside it (Marten, 1924).
In this essay we examine the outbreak of influenza in colonial India, also known as Spanish Flu, and its severe impact on the population growth in the decade of 1911-1921.
The influenza epidemic was very probably the deadliest single event in India's recorded demographic history, although its magnitude remains disputed, with credible modern estimates ranging from roughly 11 million to about 20 million deaths.

The Impact of World War I
It might be supposed that the great war would have left a deep mark on the population of a country that supplied more than a million men to the imperial war effort. The 1921 census says otherwise. “While many of the factors and conditions… are indirectly due to the war,” Marten wrote, “the war itself had little direct effect on the population of India.”
Deaths among the officers and ranks of Indian Army units and labour corps numbered 58,238. The maximum serving outside India at any one time between 1914 and 1919 was about 480,000, falling to roughly 125,800 by the census. Against a population of 319 million, these figures look tiny. Kenneth Hill (2011) likewise sets total Indian Army deaths at no more than 74,000 and treats the war as a negligible component of the difference between the two decades.
The clearest statement on the point comes from the Punjab, the main recruiting province, quoted by Marten from Mr. Middleton's provincial report:
“It comes as a shock to the imagination to compare the mortality directly caused by the war with that due to natural causes; though war casualties were amongst the pick of the population they were numerically insignificant when contrasted with the death-roll caused by the slightest of epidemics; indeed it is undoubtedly true… that the war saved more lives in the Punjab owing to the collection of men in cantonments where the ravages of influenza in 1918 were met by efficient medical precautions and remedies than it wasted on the field of battle.”
For the Punjab, in other words, the war may have been demographically positive, because the concentration of able-bodied men in medically supervised cantonments sheltered them from the influenza moving through the unprotected villages.
War Economy, Failed Monsoons and a Weakened Population
The influenza did not strike a healthy or well-fed population. The Report divides the decade into “a fairly normal period from 1911 to 1917” and “the disastrous epidemic year 1918, accompanied by scarcity and followed by a second crop failure in 1920.” From 1917 the war economy began to have its effects. Demand for men, food, munitions and war material dislocated the railways and internal distribution, and rising prices of imported necessities such as salt, oil, cloth hit the poorer classes severely (Marten, 1924).
Then came the seasons of 1918–1919. The monsoon of 1918 was noted as “exceptionally feeble” and gave practically no rain after the beginning of September. Crops failed across the Punjab and the central and western tracts, the outturn of rice fell from nearly 40,000 to 24,000 thousand tons, and prices of necessities rose dramatically. The crop failure was as bad as, if not worse than, that of 1900. Upon this population weakened by dearth, high prices and the exhaustion of the war years, the influenza arrived.
More recent work such as Tumbe’s (2020a, b) sharpens this argument into what as a drought–disease–price nexus. Meteorological records from 1870 to 2000 show 1917 as the wettest year on record, creating conditions for the malaria and plague outbreaks immediately preceding the influenza, while 1918 was the third worst year of deficient rainfall in the same series (Tumbe, 2020a).
The resulting malnutrition reduced physical resistance, and grain exports in support of the war made matters worse. In macroeconomic terms 1918–19 was the worst year in modern Indian history: real GDP contracted by about 10 percent and inflation reached 30 percent.
The Two Waves
The Census Report described an epidemic that “invaded the continent of India in two distinct waves.” The first radiated from Bombay and moved eastward, most probably introduced through international shipping in May 1918. Mild cases were noted earlier at Bombay, Delhi and Meerut, though the disease was not confirmed in epidemic form before June. Widespread by August and spreading rapidly by rail, road and water, it was found chiefly in urban areas. Although not highly virulent, it fell most heavily on young children and the elderly. Mortality peaked in July and then declined (Marten, 1924).
The second wave was of a different order. By September a more virulent strain appeared in the Poona district and spread from province to province, lasting eight to ten weeks in each region and peaking in November. Its respiratory manifestation was severe and frequently developed into fatal pneumonia, and it fell most heavily on adults aged 20 to 40, and especially on women.
Villages suffered from poor sanitation, the near-total absence of medical services, difficulty in burying the dead and the collapse of agricultural work. The November climax coincided with cold weather and a record price for cloth, so that many poor families could not afford the warm clothing that would have helped them resist a respiratory illness (Marten, 1921; Tumbe, 2020a, b).
Hill's (2011) month-by-month reconstruction of registered deaths largely confirms this account. He dates the arrival of the virulent wave in Bombay to early September 1918 and finds the impact almost entirely concentrated in the four months to December.
Bombay peaked earliest in October, followed by Madras and Delhi, and Assam, Bihar and the United Provinces which was affected last. However, the severity varied a great deal. In Bombay Presidency and in the Central Provinces and Berar the peak month carried more than ten times the normal number of deaths, while in Bengal the ratio scarcely rose above two.


The Geography of the Epidemic
Census officials described the incidence of the disease as ‘capricious’, and the interior tracts suffered far more severely than the coastal regions. The Central Provinces and Berar were the worst affected, with an estimated death rate of 66.4 per mille, which wiped out the natural increase of the whole decade. Other areas with high mortality included Ajmer-Merwara (59.5), Delhi (56.6) and the Bombay Presidency (54.9).

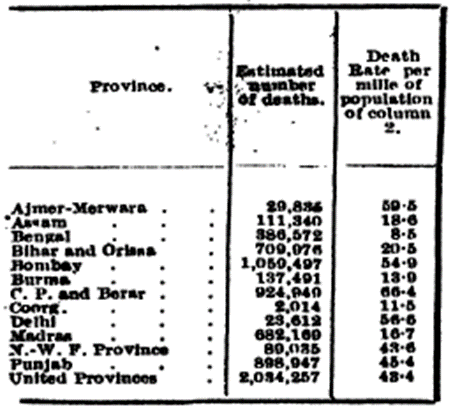
Within provinces the variation was equally wide. In the Madras Presidency the Deccan division recorded a fever mortality rate of 50.8 per mille and the Agency division 35.4 per mille, while the East Coast South division escaped with 13.4 per mille; Bellary district alone recorded about 55,000 excess deaths (Boag, 1922).
The epidemic was severe in the North-West Frontier areas and parts of the Kashmir State. In the Punjab, the prosperity created by canal irrigation did much to offset the high death rate of 1918, as the rapid recovery of the birth rate shows, while in Bengal and Madras unhealthy conditions were more localised and growth was only partially retarded.
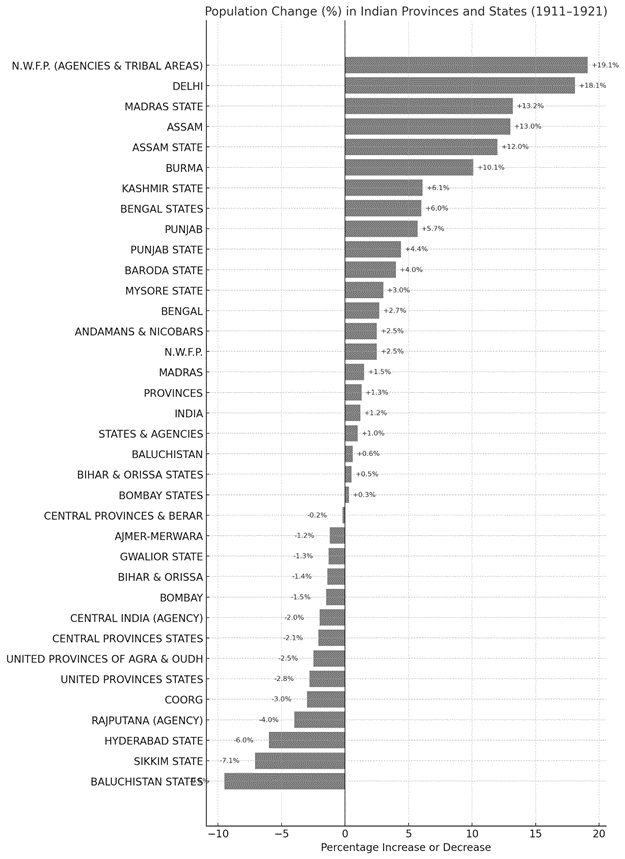
At the level of the census's own provincial units, Assam (about +13 percent) and Burma (about +10 percent) escaped the worst. Punjab grew by nearly 6 percent, while Bengal (+2.7 percent) and Madras (+1.5 percent) suffered only partial retardation.
There was decline in the interior regions, such as Hyderabad State which fell about 6 percent, the Rajputana Agency about 4 percent, the United Provinces about 2.5 percent and Bombay about 1.5 percent. As Marten noted, the epidemic “wiped off the whole of the natural increase in the Central Provinces and Berar, Bihar and Orissa and Bombay and substantially reduced the population in the United Provinces, the Rajputana and Central India Agencies and the Hyderabad State.”
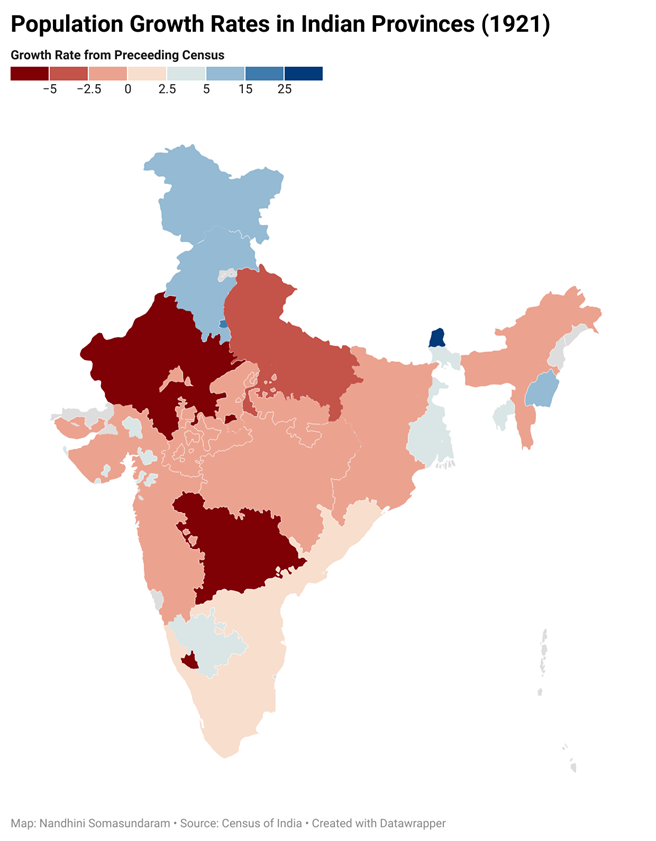
Compared with the growth within the present-day state boundaries, the same data run from strong growth in Tripura, Assam, Delhi and Kerala to outright loss in Rajasthan, Uttar Pradesh, Maharashtra, West Bengal and Madhya Pradesh.

At district scale the divergence sharpens further. The deepest losses cluster in the dry interior of the centre and west, in districts of present-day Maharashtra, Rajasthan and Madhya Pradesh, while the canal-irrigated north-west and the immigrant-receiving north-east show gains.
A few regions such as the Punjab, Haryana, Assam, Tripura and the Delhi area, recorded growth above the rate expected in the pandemic's absence, consistent with the canal-colony and tea-garden dynamics the Report emphasized.
Hill's (2011) district-level study of the Central Provinces and Berar puts numbers on this variation. He estimates about 909,000 excess deaths in the province between August 1918 and July 1919, an excess death rate of 62 per 1,000. Damoh district records 113 per 1,000, meaning more than a tenth of its population died, while Bilaspur and Rajpur fall below 40.
The average date of peak mortality varies only from mid-October in Nagpur to mid-November in Bilaspur, so the epidemic crossed the province in about a month, and he found no relationship between how early a district was hit and how badly (Hill, 2011).
Testing district characteristics from the 1911 census against the excess death rate, Hill (2011) finds three variables accounting for about two-thirds of the variation: the sex ratio and out-migration, both negatively associated, and average rainfall, positively associated. The rainfall result points towards humidity, and connects with Gill's (1928) older argument that a large diurnal temperature range, by producing a cold and humid period every night, favoured transmission and pneumonic complications.
How Many Died? The Problem of Counting
Here the census confronts the limits of its own instruments. Influenza was not a registration category; the deaths it caused were recorded, if at all, under ‘fever’ or various respiratory ailments. Estimation was therefore indirect. It compared recorded mortality in 1918 with the ‘normal’ mortality of surrounding years and treated the excess as the epidemic's toll.

On this basis the Report's contemporaries arrived at approximately 7.1 million influenza deaths in registered areas in 1918, rising to over 8.5 million with 1919. Everyone involved understood this to be an undercount, because the vital statistics machinery had broken down during the crisis, with registration staff frequently incapacitated by the disease themselves.
Special inquiries in Bengal suggested that about 25 percent of deaths went unrecorded and that female deaths in particular were under-reported,
while Mr. Middleton's studies in the Punjab put errors in death registration at 9 to 29 percent. The Report concluded that the accuracy of India's vital statistics did not exceed 7 to 8 percent.
Kingsley Davis and the Case for About 20 Million
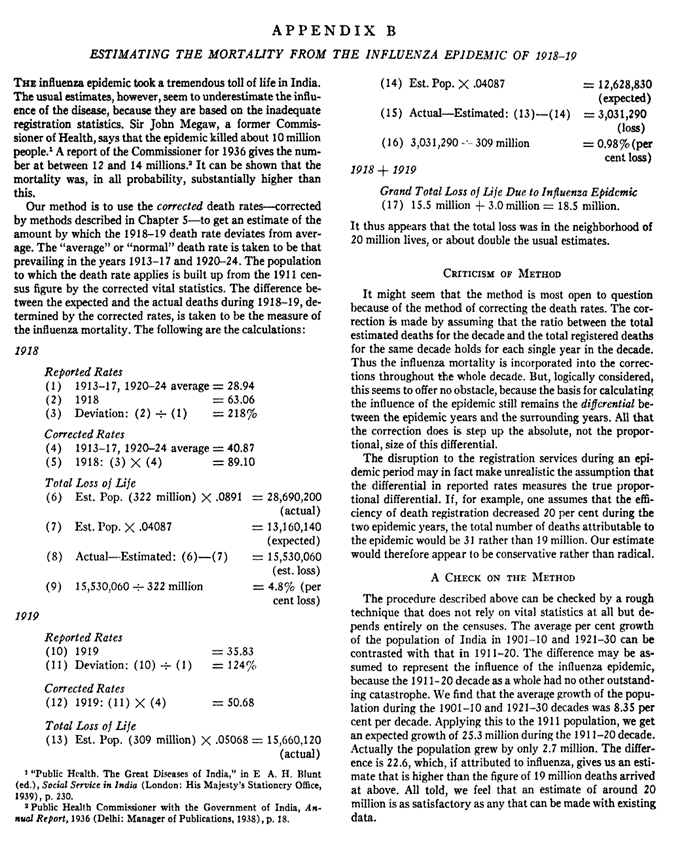
A revised estimation came a generation later from Kingsley Davis, in 1951. Davis (1951) argued that the usual figures underestimated the disaster because they rested on inadequate registration. His method was to correct the reported death rates and then measure how far the 1918–1919 rate deviated from a ‘normal’ rate defined as the average.
For 1918, the reported death rate of 63.06 per thousand deviated from the 28.94 average by 218 percent. Applying that deviation to a corrected baseline of 40.87 gave a corrected 1918 rate of 89.10 per thousand. Against a population of 322 million, this implied about 28.69 million actual deaths against 13.16 million expected — an excess of roughly 15.5 million in one year.
Repeating this exercise for 1919 yielded a further 3.0 million, with a total of 18.5 million, which Davis rounded up to around 20 million lives.
Davis (1951) then tested this against an independent method using no vital statistics at all. Contrasting average decadal growth in 1901–1910 and 1921–1930, about 8.35 percent, with the actual growth of 1911–1920, he computed an expected increase of some 25.3 million against an actual increase of about 2.7 million.
He also noted a weakness in the correction method. It assumed the ratio of unrecorded to recorded deaths held steady across the decade, whereas registration deteriorated during the epidemic itself. Had registration efficiency fallen by 20 percent in those years, the implied total would rise by about 3.1 million. On that reasoning he considered his figure conservative rather than radical.
Kenneth Hill's Reassessment
The most substantial challenge to the Davis figure came from Kenneth Hill in 2011. His contribution was twofold. First, he applied more flexible methods for assessing how incomplete registration actually was, and then he separated deaths from births in the census shortfall.
Hill applied three techniques to the census counts of 1911 and 1921 and the registered deaths between them. 1) a stationary-population assumption, 2) the Brass Growth Balance method used by Mills (1989), and 3) the more flexible General Growth Balance method.
The three give completeness estimates for all India of 60 to 66 percent for males and 62 to 68 percent for females. Hill adopts 66 percent above age 5, higher than Mills's 60 percent and slightly lower than the 70.7 percent implied by Davis. For the Central Provinces and Berar the same methods suggest registration was close to complete.
The more consequential point concerns what the population shortfall actually measures. Comparing the recorded 1921 population with what the 1901–1911 growth rate would have produced, Hill (2011) found a shortfall of 17.8 million for India as a whole, or 5.7 percent of the 1911 population, close to the totals Davis and others treated as excess deaths.
However, when the calculation is restricted to people aged 5 and over in 1921, excluding anyone who would have been born during or after the epidemic, the shortfall falls to 8.9 million, or 3.3 percent.
Roughly half of the ‘missing’ population consists of births that never happened rather than people who died.
The registered birth series supports this. Relative to the average for 1913 to 1917, births fell to 92 percent in 1918 and 78 percent in 1919, recovering only to about 85 percent in 1920 and 1921. In the Central Provinces and Berar the dip was sharper, at 90, 71 and about 80 percent.
The 1918 decline reflects deaths of women in late pregnancy and probably more stillbirths. In addition, the 1919 figures reflected conceptions that did not occur because husbands had died, lower conception rates among surviving couples and higher miscarriage rates.
Combining adjusted registered deaths with the shortfall at ages 5 and over, Hill (2011) arrives at 8.9 to 11.5 million excess deaths above age 5, with perhaps a further two million below it, for a total of roughly 10.9 to 13.5 million.
This sits well below Davis's (1951) 18.5 to 22.6 million and Mills's (1986, 1989) 17.4 to 18.5 million, and close to the 13.8 million that Chandra et. al. (2012) obtained for the British-administered provinces alone. Hill (2011) is candid that his results are not fully consistent and that the estimates from adjusted registered deaths exceed those from population shortfall above age 5 by about 2.6 million.
The shortfall was much heavier in the Princely states than in the British-administered provinces, 11.1 percent against 4.2 percent at all ages, though migration between the two may explain part of the gap.
Comparative work reaches the same conclusion about India's position. Murray et. al. (2006) estimated that the epidemic raised India's crude death rate in 1918 to 1920 by about 14.6 per 1,000 above the average for surrounding years, half as much again as in the next most severely affected country in their sample.
Whatever the correct total, the mortality effect per head appears to have been higher in India than anywhere else.
The main estimates are summarised in the table below.
Sourcea | Estimated excess deaths | Basis of the estimate |
Registered deaths, 1918–19 | 8.5 million | Unadjusted civil registration; acknowledged undercount |
Sir John Megaw (1930s) | about 10 million | Contemporary official assessment |
Public Health report, 1936 | 12–14 million | Contemporary official assessment |
Chandra et. al (2012) | about 13.8 million | District-level data, British provinces only |
Hill (2011) | 10.9–13.5 million | Registration completeness of 66 percent; population shortfall at ages 5+ |
Mills (1986, 1989) | 17.4–18.5 million | Brass Growth Balance adjustment of registered deaths |
Davis (1951) | 18.5–22.6 million | Corrected death rates, checked against lost decadal growth |
Tumbe (2020a, b) | about 20 million | Revised estimate for the subcontinent, 6.4 percent of population |
Principal estimates of excess mortality from the 1918–1919 influenza epidemic in India. Source : Tumbe (2020)
These figures reflect a judgment about how far colonial registration undercounted death, and a methodological one about whether lost population growth measures deaths or also the children never born. The revisions of Davis (1951) and Mills (1986, 1989) remain the most widely cited, while later Hill's (2011) work suggests a figure of 20 million is also notable.
Selective Mortality: Age, Sex and Social Position
The 1918 influenza was unusual in whom it killed. Unlike most epidemics, which fall hardest on the very young and the elderly, the second wave produced what Tumbe (2020b) described as a W-shaped mortality signature. Death rates were very high among adults aged 20 to 40, and in some provinces excess mortality in this group was nearly four times the average.
Hill's (2011) age-specific analysis for the Central Provinces and Berar shows the same pattern. The ratio of deaths in 1918–19 to the average for 1917 and 1920 peaks in the 20–29 age group at close to three, and is much lower for children and the elderly. This suggests that the population of younger and able bodied was affected more than children and elderly population.

Adult women suffered more severely than men. The census report attributed this partly to their role as caregivers. Women nursed the sick in crowded, poorly ventilated houses, often while ill themselves, and the disease was frequently fatal to pregnant women. In the sixteen worst-affected districts of Madras, female deaths per 1,000 males were well above the average (Boag, 1922).
Social position mattered as well. In Bombay city, Europeans and Parsis had a death rate of about 1 percent, while the rate among low-caste Hindus was more than six times higher (Tumbe, 2020a). Adivasi communities such as the Santals and Bhils were severely affected, and the Dangs region lost over 15 percent of its population.
Religious communities were affected with varying intensity, largely through geography, occupation and economic status rather than belief. Marten (1924) observed that Hindus were more severely affected than Musalmans because of their greater concentration in the Central Provinces, the United Provinces and the Bombay Presidency.
The Muslim community, concentrated in Eastern Bengal or living in towns with better access to relief, had a measure of protection. Christians recorded a lower rate than either group, chiefly because much of the community lived in South India, and Parsis recorded a slight increase of 2.3 percent over the decade, attributed to their concentration in Bombay City and the Gujarat coast. Their standards of living made medical care easier to obtain.
Year | Hindus (deaths per mille) | Muslims (deaths per mille) |
1917 (pre-pandemic) | 33.3 | 31.9 |
1918 (peak of the epidemic) | 64.6 | 56.1 |
1919 (lingering waves) | 36.4 | 33.6 |
Reported mortality by religion, 1917–1919 (deaths per mille). (Source: Marten, 1924.)
Aftermath
The loss of life among people in their reproductive prime pushed birth rates down; in the Madras Presidency the birth rate fell from 32 per mille to 25.5 by 1919. This reproductive gap is why 1911–1921 remains the only decade in the twentieth century to register negative population growth within present-day Indian boundaries, and why, as Hill's (2011) analysis shows, the census shortfall is a poor direct measure of deaths.
The pandemic was also a turning point for public health administration. Soon afterwards the Government of India changed the title of ‘Sanitary Commissioner’ to ‘Public Health Commissioner’, and plans were made for epidemiological units to handle future outbreaks.
Economically, the mortality caused labour shortages in industries such as tea and coal mining, and the winter of 1918–19 was identified by the Royal Commission on Labour as a turning point for industrial strikes in India (Tumbe, 2020a).
Cultural Imprints
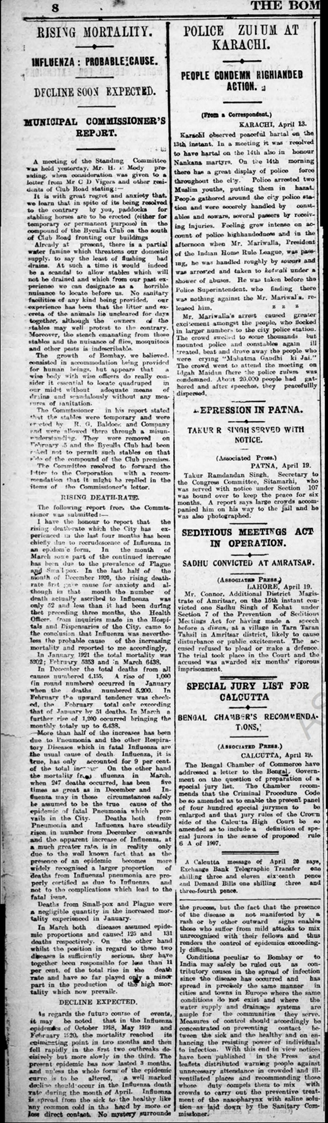
“I travelled to the riverbank in Dalmau and waited, the Ganga was swollen with dead bodies. At my in-laws’ house, I learned that my wife had passed away.” “This was the strangest time in my life,” he recalled later. “My family disappeared in the blink of an eye. All our sharecroppers and labourers died, the four who worked for my cousin, as well as the two who worked for me. My cousin’s eldest son was fifteen years old, my young daughter a year old. In whichever direction I turned, I saw darkness.” “The newspapers had informed us about the ravages of the epidemic…”
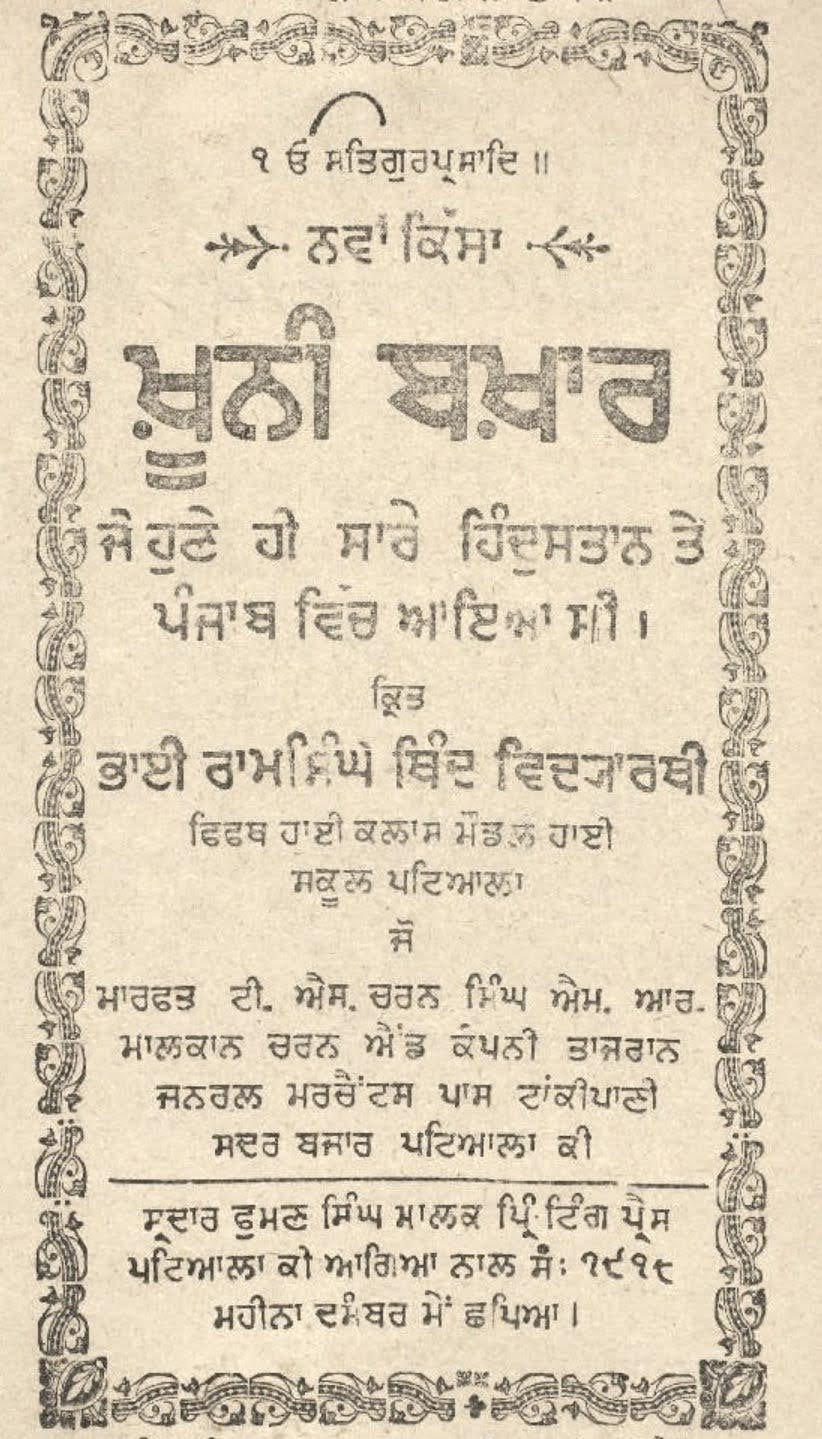 (Cover Page of Khooni Bukhar) |
The effect on education was long-lasting. Schools and colleges closed as students and staff fell ill; in Bombay a student at Grant Medical College, Krishna Natarajan, died while volunteering to nurse the poor. The second wave left a large number of orphans, and the government established creches administered by district collectors (Tumbe, 2020a).
In central India, surviving guardians often failed to send children back to school, and because the epidemic had reduced the adult workforce, many families kept children at home to work in the fields. At the university level, the principal of Sydenham College in Bombay complained that the epidemic's leniency in grading had produced the college's least competent batch (Tumbe, 2020a).
The pandemic also left a mark on rural religious life. In the Dangs region of Gujarat the memory of the epidemic survived in folklore as ‘manmodi’, a term describing a time when the dead were so numerous that survivors threw bodies off cliffs. Traditional healers, the bhagats, lost standing when their remedies failed, and a new cult emerged around the goddess Salabai, worshipped for protection against the infection (Tumbe, 2020a).
On any of the estimates surveyed in this essay, India accounted for a large share of global pandemic mortality. Despite this excessive death toll, this event remained partially forgotten with a remarkable lack of visual evidence, first-hand testimony, and public memorialisation.
India’s previous experience with bubonic plague (beginning in 1896) had generated vast scientific reports, draconian state measures and socio-political reactions. In contrast, influenza was a viral disease that was harder to identify, and the government, chastened by the public backlash to its plague policies, was more lethargic and inactive during the 1918 crisis (Arnold, 2019).
The pandemic was inextricably linked to the Great War, often being dismissed in the popular imagination as "war fever". While Indian soldiers who died in the war were memorialized with monuments, there was no formal commemoration for the influenza victims (Arnold, 2019).
The crisis instead fueled the growth of Indian civil society, as middle-class philanthropic organizations filled the gap left by the state's inactivity, further shifting the focus toward nationalist self-determination. The silence in the historical record is not a sign of the epidemic's insignificance but a result of a fragile colonial state and a society focused on more immediate political and survival crises (Arnold, 2019).
Conclusion
The war, so prominent in the political history of the period, left almost no imprint on the population totals. In contrast the influenza death toll was so poorly captured by the registration machinery that its magnitude had to be reconstructed indirectly, first by Marten's contemporaries, then by Davis, and then by a modern generation of demographers.
Behind the national average growth rate of 1.2 percent, lay a subcontinent in which the natural increase of seven years was erased in a few months, in which young adults and particularly young women died at several times the ordinary rate, and in which, for years afterwards, many children were simply never born.
Despite this, the epidemic largely disappeared from public memory, quickly overshadowed by political events including the Jallianwala Bagh massacre of 1919 and the rise of the Non-Cooperation Movement (Tumbe, 2020a). Unlike the chronic presence of plague or cholera, it was brief and intense, leaving few survivors to carry a long-term narrative of the disease.
The 1921 Census remains the most complete record of that moment, documenting a population held stationary by what Marten called the “legacy of the past” and by the mortality of the epidemic (Marten, 1924).
Although these figures of mass mortality caused by this epidemic are historical, the suffering they represented was real and profound.
(Author Contributions:
Naddhini did research and primary writing, along with data visualizations.
Siddharth Contributed to research and writing.
Gaurav contributed to research, writing and did editing.
Shivakumar contributed to conceptualization, research, data visualizations and editing)
References
Arnold, D. (2019). Death and the modern empire: The 1918–19 influenza epidemic in India. Transactions of the Royal Historical Society, 29, 181–200. https://doi.org/10.1017/S0080440119000082
Boag, G. T. (1922). Census of India, 1921, Volume XIII: Madras — Part I, Report. Government Press. Madras.
Chandra, S., Kuljanin, G., and Wray, J. (2012). ‘Mortality from the Influenza Pandemic of 1918–1919: The Case of India’, Demography 49(3), 857–865.
Davis, K. (1951). The Population of India and Pakistan. Princeton: Princeton University Press.
Hill, K. (2011). ‘Influenza in India 1918: excess mortality reassessed’, Genus, 67(2), 9–29.
Gill, C. A. (1928). The Genesis of Epidemics and the Natural History of Disease: An Introduction to the Science of Epidemiology Based upon the Study of Epidemics of Malaria, Influenza, and Plague. London: Baillière, Tindall and Cox.
Marten, J. T. (1924). Census of India, 1921: Volume I, India — Part I, Report. Calcutta: Superintendent Government Printing, India.
Mills, I. D. (1986). ‘The 1918–1919 Influenza Pandemic - The Indian Experience’, Indian Economic and Social History Review 23(1), 1–40.
Mills, I. D. (1989). ‘Influenza in India during 1918–19’, in T. Dyson (ed.), India’s Historical Demography. London: Curzon Press, 222–260.
Murray, C. J. L., Lopez, A., Chin, B., Feehan, D., and Hill, K. (2006). ‘Estimation of potential global pandemic influenza mortality on the basis of vital registry data from the 1918–20 pandemic’. The Lancet 368, 1211–1221.
Public Health Commissioner (1921). Annual Report of the Public Health Commissioner with the Government of India for 1921. Superintendent Government Printing, India. Calcutta
Tumbe, C. (2020a). The Age of Pandemics (1817–1920): How they Shaped India and the World. HarperCollins India.
Tumbe, C. (2020b). Pandemics and Historical Mortality in India. IIMA Working Paper. Indian Institute of Management, Ahemdabad.


Comments