
14 | Findings on Language, Religion and Caste and Tribal status in the 1891 Census Report
- Apr 4
- 18 min read
By Gaurav Kalyani & Shivakumar Jolad
Published on: 11 June 2026
Introduction
The 1891 census was, by any measure, an extraordinary achievement. It enumerated a population of 287 million, a fifth of humanity at that time. While the census was a State operation for the imperial regime, its true value lay in capturing the everyday observation of the masses. It revealed a world on the precipice of modernity, yet tied to the orthodoxies and customs of the old.
The Census Commissioner of 1891, Jervoise Athelstane Baines, in his general report, discloses the possibilities and limitations of knowledge about the subcontinent and the socio-economic life of its varied inhabitants. This essay will look at how Baines tried to make sense of the vast social diversity of the Indian subcontinent based on the data and insights gathered from the 1891 census.
Ethnographic Distribution of Population
Chapter V of the General Census 1891 report represents an ambitious attempt made to classify the Indian population. The chapter is divided into three sections: A (Mother Tongue), B (Religion), and C (Race, Tribe, or Caste). Each section grapples with the same fundamental problem: how to classify a population that defies tidy categorisation.
The ‘caste spirit’, as Baines terms it, permeates every aspect of Indian life. In religion, abstract conceptions give way to tutelary deities of the village or forest. The monotheism of Islam dissolves into the adoration of locally canonised ascetics. The result is a social system of “mutually repellent groups, cramping to the sympathies and to the capacity for thought and action.”
Language and Mother Tongue
Coverage: The mother-tongue inquiry, as Baines says, was retained from 1881 not for direct comparison but to aid in future philological inquiry. The census successfully classified over 262 million speakers into a hierarchical scheme of language families. The geographical coverage of language enumeration was, however, not complete. Kashmir, Central India, large parts of Rajputana, and the wild tracts of the eastern frontier were omitted from the language return. Manipur, whose census records were destroyed in the outbreak of March 1891, was lost entirely. In total, over 26 million people were excluded from the linguistic tables. Baines regretted these omissions, particularly in the Himalayan borderlands where ‘archaic tongues’ were thought to be already dying out. He issued a plea for a systematic, specialist-led survey.

The results are summarised in Table reproduced below in condensed form:

The Indo-Aryan group dominated overwhelmingly, accounting for nearly three-quarters of the population. Baines noted that Hindi “includes all the Aryan speech between the Jamna and Rajmahál,” absorbing dialectal distinctions such as Vraj, Baiswári, Bhojpúri, and Maithili. The boundaries between Hindi, Panjabi, and Marwadi were scarcely distinguishable. This subsumption, he suggested, was partly administrative, writing, “the language of the plains is officially ‘Hindustáni,’ so it is not likely that any attempt would be made through the medium of the census to contravene this authoritative decision.”
Perhaps the most striking conclusion of Baines's report was the absence of a genuine pan-Indian lingua franca. What was commonly described as Hindustani, he argued, amounted largely to local vernaculars supplemented by a limited infusion of Persian vocabulary.
Reflecting on the growing divide between elite and popular speech, Baines cited James Russell Lowell's observation that the language of the educated classes often formed “an artificial stratum” that suppressed the organic development of the “voice of the people.” He cautioned that literary languages could become increasingly pedantic and detached from everyday speech. In attempting to map India's linguistic diversity, Baines also exposed the social hierarchies and cultural cleavages embedded within it.
Baines provided a historical sketch of the forces that fragmented India’s linguistic landscape. The Census 1891 report notes that the Arya, who entered India from the north-west, did not arrive as a united but as “various collections of clans which were disintegrated with great rapidity into small independent bodies.” A separate article in our series dives deeper into the linguistic debate surrounding the Aryan Invasion/Migration theory.
The traditional Brahmanic hierarchy, with its monopoly over sacred texts weakened the hold of the original language among non-priestly classes. Baiens further notes that “The farther the latter spread over the country from the primary settlements, the more exaggerated was the value the priest was able to place on the exact knowledge of the sacred words”. He comments that Buddhism, which repudiated the Brahmanic monopoly, temporarily reversed this trend by preaching in the vernacular Mágadhi dialect. But Buddhism’s decline left the field open to a regenerated Brahmanism.
The later Muslim invasions imported Persian and Arabic vocabulary but left grammar and structure untouched. Urdu, Baines explains, “consists of the vernacular of the tract round the seat of government interlaced with large numbers of Persian words.” Yet even among the Muslim converts, the local vernaculars persisted.
In Baltistan, where the population is almost entirely Muslim, “the language is the same as that of their Buddhistic neighbours in Ladákh, and only the special terms required by the new faith are introduced”, the report observed.
Baines presents a statement showing that for most forest tribes, the number returning their ancestral tongue is far smaller than the tribal population. The following table summarises the key discrepancies:
Table: Comparison of Tribal Population and Tribal Language (1891)
Tribe | Population by Tribe | Speakers of Tribal Language | Deficit |
Bhíl | 933,512 | 148,596 | -784,916 |
Baiga, Bhinjwa, etc. | 1,030,332 | 48,883 | -981,449 |
Gónd | 2,897,591 | 1,379,560 | -1,518,031 |
Kóchh | 2,364,365 | 8,107 | -2,356,258 |
Santhál | 1,494,045 | 1,642,154 | +148,109 (anomaly) |
Sáwara | 438,317 | 102,039 | -336,278 |
Kandh (Khond) | 627,388 | 320,071 | -307,317 |
Source: (Baines, 1893)
Baines notes that “The general drift of the statements to show how the tribal tongues are falling before the general dialects of the plains.” He attributes this to the spread of Hindi, Oriya, and Bengali into hill tracts through trade, administration, and missionary activity.
Comparisons with 1881
Direct comparison between the two censuses was difficult. “Owing to the wider scope of the present operations, partly perhaps to the better understanding of the rules by the enumerators,” Baines wrote, “it is only in the purely localised or tribal dialects that such comparison could be practicable.”
The number of persons returning Sanskrit as their mother tongue fell from over 1,300 in 1881 to just 308 in 1891 – a decline attributed to the correction of ‘schoolboy’ and ‘undergraduate’ affectations. More significantly, the Môn language of Lower Burma increased from 154,553 speakers in 1881 to 226,495 in 1891. Baines speculated that the language was either reviving or people reluctant during previous census, now returned themselves as speakers of Môn.
The Karén language (spoken by Karen people of lower Burma) also showed a substantial increase, from 540,876 tribal members to 674,846 speakers. The report suggests that missionary education may have strengthened rather than weakened linguistic identity, although it remains unclear.
Religion
Baines opened the religion chapter with a deceptively simple question: what constituted a distinct religion in India, and what was merely a sect or local variation? For census purposes, he distinguished Brahmanism (his preferred term for Hinduism) from its offshoots, such as Sikhism and Jainism, and from foreign religions like Islam, Christianity, Zoroastrianism, and Judaism. Tribal belief systems were grouped under the category of Animism, which he defined, drawing on C. P. Tiele, as belief in spirits and souls, often expressed in India through tribal religions centred on magic, spirit worship, and exorcism.
Yet Baines recognised that these categories were far from clear-cut. In many forest and hill regions, the boundary between Animism and Brahmanism was highly arbitrary, with census enumerators often classifying marginal groups outside the Brahmanical fold.
He preferred the term Brahmanism because it highlighted what he saw as its defining features: hereditary social status and priestly authority. Although over 72 percent of Indians were classified under this category, Baines cautioned that it (Brahmanism) encompassed an immense diversity of beliefs and communities. Its enduring strength, he argued (drawing on the French scholar Barth), lay in its remarkable capacity for absorption and adaptation, enabling it to survive challenges such as Buddhism and incorporate local tribal deities and practices into its fold.
Table: Religious Distribution of India (1891) with Variation since 1881
Religion | Population (1891) | Percentage | Approx. % Variation since 1881 |
Brahmanic (Hindu) | 207,731,727 | 72.33 | – |
Animistic | 9,280,467 | 3.23 | +10.82 |
Sikh | 1,907,833 | 0.66 | +2.12 |
Jain | 1,416,638 | 0.49 | +14.86 |
Zoroastrian (Parsi) | 89,904 | 0.03 | +4.91 |
Buddhist | 7,131,361 | 2.48 | +24.46 |
Jew | 17,194 | 0.006 | +20.93 |
Christian | 2,284,380 | 0.80 | +21.85 |
Musalman (Muslim) | 57,321,164 | 19.96 | +10.61 |
Minor forms | 185 | – | – |
Baines provided a concise history of Buddhism in India, tracing its rise as a reaction against Brahmanic sacerdotalism, its spread under royal patronage, and its eventual decline. The key to Buddhism’s early success, he argued, was its rejection of the Brahmanic monopoly over salvation. Its remnants in the 1891 census, 7.1 million persons (mostly in Burma) were almost entirely of Thibetan or Burmese extraction.
Muslims constituted nearly 20 percent of India’s population, 57.3 million persons, or a large majority of the world’s Muslims at the time. Baines distinguished between foreign Muslims (descendants of invaders and immigrants) and Indian converts. The former are concentrated in Sindh (77 percent), Kashmir (70 percent), and the North-West Frontier; the latter are found across the subcontinent, particularly in eastern Bengal.

The conversion of India to Islam, Baines noted, was not primarily a matter of doctrinal persuasion but of social and political pressure. What emerged was a distinctly Indian Islam, in which “the simplicity of the Kurán made but a feeble appeal to the mind of those accustomed to the sensuous rites of the new Brahmanism.”
In eastern Bengal, however, Islam has had a more transformative effect. The provincial census superintendent attributed the higher growth rate of the Muslim population to three factors: rise in social status, greater variety of diet, and, crucially, the absence of prohibition on widow marriage and the later age of marriage for girls.
The Christian population (2.28 million, 0.8 percent) is overwhelmingly native Indian (89 percent), with a small European element (7.4 percent) and a Eurasian component (3.5 percent). The Roman Church accounts for 57.6 percent of Indian Christians, the Reformed churches for 32.9 percent, and the Syrian (Jacobite) church for 8.7 percent.
Baines noted Christianity, like Islam, appealed to “a class of the population whose position is hereditarily and permanently degraded by their own religion.” On the Malabar coast, early Portuguese missionaries found it necessary to maintain caste distinctions within the church – separating upper from lower castes, to attract converts.
The Parsis (Zoroastrians) numbered just under 90,000, concentrated in Bombay (52.8 percent) and the surrounding Gujarat coast. They preserved their religious identity, despite speaking Indian languages such as Gujarati, instead of Persian.
The Jewish population (17,194) was also concentrated in Bombay, Aden, Cochin, and Calcutta. The Census 1891 report noted the ‘White Jews’ of Cochin claimed to have kept aloof from intermarriage; while the ‘Black Jews’ did not. Both communities, Baines noted, “speak a northern dialect of Arabic” in Aden and Marathi or Malayalam in India.
A detailed table below shows the proportion of each religion to 10,000 of the population in each province and state.

A few immediate patterns stand out from this chart:
Burma (Upper and Lower) is overwhelmingly Buddhist (>85%).
Sindh, Kashmir, Aden, and Punjab show Muslim majorities.
Punjab States has a substantial Sikh share, unlike most other regions.
Central Provinces States, Assam, and Central India show notable Animistic populations, reflecting the census category used for many tribal communities.
Madras States stands out for its unusually large Christian population.
Most princely states of western and southern India (Mysore, Baroda, Hyderabad, Rajputana) remain predominantly classified as Brahmanic/Hindu.
Race, Tribe, or Caste – The Anatomy of Hierarchy
Defining Caste
The third section of Chapter V, which is dedicated to caste, is the longest and most complex. Baines tackles the question of caste and its relationship to race, occupation, and religion.
He began by rejecting any simple equation of caste with Hinduism, and notes “Caste is a development of the special tendency to which the social atmosphere of India is abnormally favourable, and is not, therefore, the peculiar attribute of the Brahmanic form of religion”.
Baines suggested a distinctly racial origin of caste, noting that “the distinction between the Aryan and the non-Aryan was one of colour.” The Brahmans, as a hierarchy, “could easily prevail on the Arya laity to exclude the subject races from participation in what seemed to be the peculiar privilege of the superior.” He further contended that this
“racial purity, if it ever existed, did not last. The repeated waves of immigration from the north-west, the absorption of forest tribes, and the incorporation of local chieftains into the Kshatriya (warrior) caste through “fictions of common origin” all contributed to the blurring of racial lines”.
The census classification of castes, tribes, and races was based primarily on function, with a secondary grouping by race for communities of foreign origin. The scheme comprised 60 groups, later collapsed into 21 classes for the purposes of the Census 1891 report. The following table shows the proportion of each major class to the total population.


Major Caste Groups
Baines provided detailed commentary on the principal castes within each group. Military and Dominant Castes (1,025 per 10,000) included Rajputs (10.4 million), Jats (6.7 million), Gujars (2.2 million), Marathas (3.3 million), and Nairs (980,000). Other Cultivators (1,670 per 10,000) formed the largest single group. The Kunbi or Kurmi (10.5 million) was noted as “the ordinary term for a tiller of the soil” in the Deccan and Gangetic valley.
Forest Tribes (551 per 10,000) were the most heterogeneous group. Baines subdivided them into nine geographical groups, from the Kolarian tribes of the north-east (Santhal, Munda, Ho) to the Bhil and Gond of central India to the Mongoloid tribes of Assam (Khasi, Kachari, Garo) and Burma (Kuki, Lushai, Khyin).
Leather Workers and Lower Village Menials (1,073 per 10,000) included the Chamar (leather workers, 11.3 million) and a range of watchman and scavenger castes (Dosadh, Pasi, Mahar, Dhed, Paraiya, Dom). Baines observed that the leather workers were traditionally “members of the village community, and were always in their present degraded rank.” But the export trade in hides and skins, and the establishment of tanneries using European capital, raised the position of this class above the ordinary village menial.
One of the intriguing passages in the general report concerns the origin of European gipsies. Baines reviewed the evidence connecting the Indian Dom and Jat castes with the Rom of Europe. The gypsies, he suggested, “are really the descendants of the 12,000 or so of musicians and earthworkers… transported to Persia, probably from Sindh, in the time of Behrám Gaur, about 400 A.D.”
Their language, customs, and caste-exclusiveness all point to an Indus Valley origin. Baines is cautious about the specific connection between Dom and Rom, noting that “the interchange of R and a palatal D” at the beginning of a word was phonetically problematic. But he concluded that the overall case for an Indian origin was strong.
1881 vs 1891
The caste enumeration in 1891 was far more systematic than in 1881. The separation of religion, sect, caste, and sub-caste into four distinct columns made it easier for the enumerators to fill the schedules. The instructions also prohibited vague terms such as “Hindustani, Marwadi, Panjabi” in the caste column, forcing a more precise response.
Nevertheless, Baines acknowledged some inconsistencies still prevailed. Two large provinces, Bengal and the North-West Provinces, submitted their caste returns six months after all others, making reclassification difficult.
We can see the improvement in enumeration is more clearly in the increase of female returns in certain castes and the more accurate recording of tribal affiliations. But Baines concluded with a note of caution that the caste system is fluid, with communities constantly “leaping over or creeping under” its barriers, that any static classification can only be approximate.
Occupation
The 1891 census introduced a fundamental change in how occupation was recorded. In 1881, enumerators had counted only those who actually worked, excluding dependents, women engaged in domestic labour, and children. As a result, Baine’s noted that “no less than 53 percent of the population got excluded.” Women, in particular, were poorly enumerated making their figures difficult for further examinations (Baines, 1893).
Although the new methods employed improved the enumerations, Baines acknowledged the difficulties with the process involved. “In the most favourable circumstances,” he wrote, “the completeness and accuracy of the enumeration is a matter of very considerable uncertainty” (Baines, 1893). People often returned caste names instead of occupations. They had multiple livelihoods and could not specify which was the principal one. Vague terms like ‘service’, ‘shopkeeping’, and ‘labour’ abounded in the census returns.
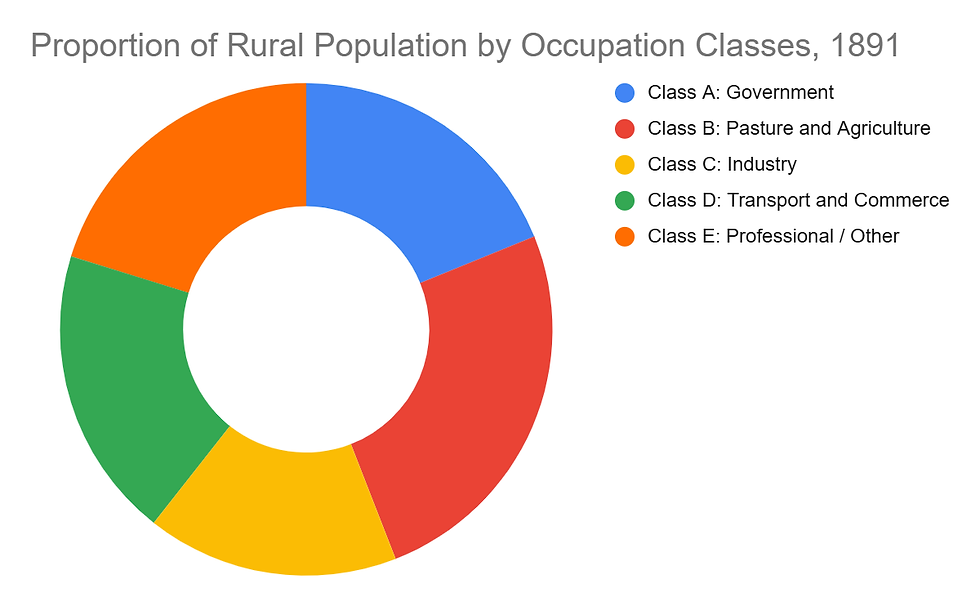
Despite these imperfections, the results were unambiguous. Baines isolates just twenty ‘primitive’ occupations that together account for nearly 85 percent of India’s population. Agriculture dominated without a doubt. Landholders and tenants alone constitute 52.98 percent of the total population. Agricultural labourers add another 6.50 percent. When general labourers (8.87 percent), pastoralists (1.45 percent), and village servants (1.07 percent) are included, the proportion of the population whose lives are tied directly to the land approaches three-quarters.

(Miller with 2 oxen, watercolour painting, c.1850s. Source: New York Public Library Digital Collections)
The remaining ‘primitive’ occupations included cotton workers (3.07 percent), goldsmiths (0.62 percent), blacksmiths (0.55 percent), brass and coppersmiths (0.14 percent), carpenters (1.06 percent), masons (0.36 percent), barbers (0.90 percent), washermen (0.72 percent), fishermen (0.95 percent), oil pressers (0.69 percent), potters (0.82 percent), leather workers (1.11 percent), scavengers (0.40 percent), priests (0.60 percent), and mendicants (1.95 percent). Baines concludes, “the 20 village occupations… comprise no less than 88 percent of the rural population, and nearly 85 percent of the whole of the inhabitants of India.”
Based on Baine's explanations in the general report, we can observe that the village was not merely a residential cluster but a self-sufficient economic microcosm. Within this traditional system, the carpenter made the plough; the blacksmith forged the ploughshare; the potter supplied the water jars; the oil-presser provided cooking oil and lamp fuel; the barber performed ritual and surgical functions; the washerman, the tanner, the scavenger, each had a hereditary place.


One of Baines’s most important observations concerns the combination of agriculture with other occupations. Using supplementary returns from provinces that tabulated partly agricultural status, he shows that:
Money-lenders are consistently the group most likely to also hold land. In the North-West Provinces, 46.67 percent of money-lenders were also landholders, compared to just 18.28 percent of the general non-agricultural population. In Assam, the figure reached an astonishing 67.65 percent.
Urban Contrasts
Although only 9.48 percent of India’s population lived in towns classified as urban, the occupational structure of cities varied dramatically. Baines provides a comparative table for five major cities: Bombay, Calcutta, Madras, Rangoon, and Haidrabad (Hyderabad). The contrasts are revealing.
Table: Top 10 Categories of Occupation
Occupation | Bombay | Calcutta | Madras | Rangoon | Hyderabad |
Administration | 3.2 | 3.87 | 4.98 | 4.34 | 14.12 |
Agriculture | 6.94 | 2.79 | 3.62 | 2.24 | 2.53 |
Personal & Domestic | 8.95 | 15.08 | 9.66 | 8.71 | 24.87 |
Food | 6.02 | 7.51 | 10.43 | 13.24 | 7.27 |
Textiles | 15.82 | 4.47 | 6.71 | 5.67 | 3.54 |
Commerce | 11.28 | 8.63 | 5.59 | 7.94 | 4.78 |
Transport | 5.16 | 10.08 | 7.45 | 8.52 | 2.54 |
Professions | 4.1 | 7.04 | 10.08 | 4.61 | 3.93 |
General Labour | 15.45 | 7.5 | 7.59 | 8.5 | 8.78 |
Independent | 3.35 | 3.68 | 5.45 | 2.62 | 7.48 |
The census narrative suggests five distinct urban economies:
Bombay was a textile-commercial city, with the highest concentration of textile workers and traders.
Calcutta was an administrative-port city, characterized by domestic service, transport, and commerce.
Madras was a professional and service centre, leading in professions and food supply occupations.
Rangoon was a port-frontier economy, specializing in food provisioning, transport, timber, and migrant labour.
Hyderabad was a princely capital, dominated by administration, defence, retainers, domestic service, and dependent classes.
In Haidrabad (Hyderabad), the capital of the Nizam’s dominions, the administrative element constituted 14.12 percent of the population, nearly three times the urban average. Defence personnel added another 9.75 percent.
Bombay, by contrast, showed the marks of industrial capitalism. Textile workers formed 15.82 percent of its population, and commerce supported 11.28 percent. The city, Baines adds, bred only a quarter of its own population, the rest were immigrants, mostly male, drawn by the mills and docks.
Literacy

The literacy inquiry in 1891 asked each person whether they were ‘Learning’ (under instruction), ‘Literate’ (able to read and write but no longer a pupil), or ‘Illiterate’. A supplementary column recorded knowledge of English among the literate. The instructions explicitly excluded those who could only sign their names or who attended rote schools where only oral recitation was taught.
The geographical coverage for literacy was incomplete. The wild tracts of the eastern frontier, Rajputana, Central India, and Kashmir were omitted from the literacy return, leaving a population of just under 262 million for analysis. Baines notes that in 1881, similar omissions had been made, but the 1891 census added Upper Burma, Quettah, Aden, and the Andamans to the enumerated area.
The returns revealed a stark proportion of illiteracy. Of the total population covered, only 1.22 percent were under instruction, and only 4.62 percent were literate. Illiterates constituted 94.16 percent. Among males, 8.66 percent were literate or under instruction; among females, the figure was a mere 0.57 percent.
Baines breaks these figures down by age. Among males under 15, 6 percent were literate or under instruction; between 15 and 25, the proportion rose to 15 percent; after 25, it fell back to 13.8 percent.
TABLE B: Proportional Abstract of Literacy
Category | Both Sexes (%) | Total Males (%) | Total Females (%) | Females per 1,000 Males | ||
Learning | 1.22 | 2.25 | 0.15 | 68 | ||
Literate | 4.62 | 8.66 | 0.42 | 47 | ||
Illiterate | 94.16 | 89.09 | 99.43 | 1,075 | ||
Breakdown by Age and Sex | ||||||
Age Period | Males: Learning (%) | Males: Literate (%) | Males: Illiterate (%) | Females: Learning (%) | Females: Literate (%) | Females: Illiterate (%) |
Under 15 | 4.74 | 1.27 | 93.99 | 0.36 | 0.18 | 99.46 |
15 to 25 | 1.96 | 13.1 | 84.94 | 0.06 | 0.85 | 99.09 |
25 and over | 0.09 | 18.73 | 81.18 | 0.01 | 0.47 | 99.52 |
The bulge in the 15–25 age group reflects the cumulative impact of education, but also the confusion between ‘pupils’ and ‘literate’ noted by several provincial superintendents. The Mysore superintendent, himself a Brahman, observed that students “returned themselves in a vast number of cases as learned, though they were still learning, probably in a spirit of bravado.”
For females, the figures were even more disappointing. Among girls under 15, only 0.54 percent were literate or under instruction; between 15 and 25, the proportion crept up to 0.91 percent; after 25, it dropped to 0.47 percent.
Baines writes, “Thus the stimulus to female education was imparted little earlier than the beginning of the present generation.”
Baines attributed such low level of literacy to three main factors:
First, the occupational bias of the population. He noted that Indian agriculturalists are likely not significantly far behind their counterparts in European nations, however, the difference lies in the substantially larger proportion of their population. “The raiyat (cultivator), sends his son to school”, Baines observed, “but the necessities of the farm generally lead to the lad’s removal at a rudimentary stage.”
Second, he observed that the long existence of a hereditary literate class such as Brahman and Kayasth, whose “object it has been to maintain their own monopoly of all book-learning as the chief buttress of their social supremacy. Sacerdotalism knows that it can reign over none but an ignorant populace”
Third, and most fundamentally, is the position of women. “It is by the position of women in it that we judge to a great extent of the relative progress made by a community towards the complete life that we call civilization,” He also blames the irony of social reformers who preach progressive values in public but lead orthodox lives in private.
One of the most contentious parts concerns the comparison between the census return of pupils and the annual returns of the State Department of Public Instruction. The departmental return exceeded the census by 25 percent for males and by 87 percent for females. Baines attributed this discrepancy to three causes.
First, the departmental returns include “rote schools” (Kuran and Puran schools) where students learn by oral repetition only and cannot read or write. The census explicitly excluded these. In Panjab alone, 57,397 such pupils were returned departmentally.
Second, fraudulent practices in the departmental returns were well documented. In Bengal, fabrication of returns in two municipalities were discovered. One schoolmaster in Chittagong transferred his entire school across a district boundary to claim a second return.
Third, the census’s stricter definition of literacy (ability to both read and write) excluded many who appeared in departmental figures as ‘under instruction’. Baines concluded that “it is not necessary to assume that the difference between the returns and those of the State department betokens any defect in the former.”
Literacy in colonial India in 1891 was highest amongst Parsi, Jewish and Jain communities. Other groups such as Hindus, Christians, Muslims, Buddhists and others exhibit varying levels of literacy, with significant disparities in female literacy. However, these religious aggregates obscure the real concentration of literacy.
Baines presents a caste-based analysis showing that just 11 caste groups, which comprised less than 14 percent of the population, account for over half of all literates and more than three-quarters of English-knowing literates.
These groups are: priests (Brahmans), temple servants, writers (Kayasth and Karan), herbalists and astrologers, traders, Burmese, Parsis, Europeans, Eurasians, Native Christians, and Goanese Christians.
TABLE: Literacy by Caste (proportion)
Caste Group | % on Total Pop. | % of Literates on Total Pop. of Group (Both Sexes) | % of Literates on Total Males in Group | % of Group Knowing English on Total Literates in Group |
I. Military Agriculturists | 9.46 | 3.94 | 7.07 | 1.55 |
II. Other Agriculturists | 17.48 | 2.81 | 5.51 | 2.39 |
III. Cattle Graziers, &c. | 4.2 | 1.19 | 2.29 | 2.65 |
IV. Field Labourers | 3.11 | 1.86 | 3.66 | 1.55 |
V. Forest Tribes | 5.04 | 0.4 | 0.78 | 2.01 |
VI. Priests | 4.9 | 15.78 | 29.52 | 5.37 |
VII. Devotees, &c. | 0.85 | 5.41 | 10.02 | 1.39 |
VIII. Temple Servants | 0.11 | 10.32 | 18.11 | 1.3 |
IX. Genealogists | 0.16 | 5.71 | 10.91 | 1 |
X. Writers | 0.94 | 23.37 | 43.59 | 8.58 |
XI. Astrologers & Herbalists | 0.1 | 17.58 | 29.72 | 11.28 |
XV. Traders | 4.11 | 15.38 | 29.3 | 2.14 |
XVII. Carriers by Pack Animal | 0.34 | 0.81 | 1.51 | 0.84 |
XVIII. Goldsmiths, &c. | 0.57 | 9.69 | 18.69 | 0.97 |
XXVI. Weavers and Dyers | 3.16 | 3.03 | 5.83 | 1.93 |
XXX. Oil Pressers | 1.66 | 3.22 | 6.32 | 2.17 |
XXXVIII. Distillers & Toddy Drawers | 1.84 | 6.11 | 11.87 | 1.13 |
XL. Leather Workers | 4.59 | 0.53 | 1.04 | 1.13 |
XLI. Village Watchmen | 4.68 | 0.62 | 1.21 | 3.09 |
XLII. Scavengers | 1.32 | 0.59 | 1.11 | 3.15 |
L. Musalmáns of Foreign Titles | 12.52 | 3.49 | 6.58 | 2.91 |
LII. Burmese Tribes & Chinese | 2.79 | 20.68 | 39.53 | 0.2 |
LIII. Western Asiatic Races | 0.04 | 45.5 | 54.89 | 33.08 |
LVI. Europeans | 0.06 | 73.24 | 78.67 | 95.79 |
LVII. Eurasians | 0.03 | 52.18 | 54.73 | 91.27 |
LVIII. Native Christians | 0.72 | 13.07 | 20.01 | 16.28 |
English and the Universities
The return of English-knowing literates after excluding Europeans and Eurasians came to 386,032, which compared poorly with the departmental record of students studying English.
Baines notes that with an average annual attendance of 337,000 studying English over the preceding five years, one might expect 700,000 to 800,000 English-knowing literates. The discrepancy, he suggests, reflects the rudimentary stage at which English study ends for most.
Of the 15,200 who presented themselves annually for matriculation, only about 34 percent passed. Of those who passed, only a fraction proceeded to a degree. The university examinations, Baines observed, produce relatively infinitesimal numbers.
Baines concludes the literacy chapter with a brief survey of Indian literature and journalism. In 1890–91, 5,595 books were published across all Indian languages. Most were textbooks or ephemeral works; “a few works on Sanskrit texts, with an occasional drama on a historical occurrence or a subject of the day are all that are likely to survive the year of their birth.”
Journalism was more vibrant, with 490 periodicals, the largest circulation reaching 20,000 in Bengal.
Conclusions
The chapters 4, 5 and 6 in the 1891 Census Census 1891 report stood as the core of Baines’s undertaking, striving to capture India’s extraordinary linguistic, religious, and social diversity. Despite imperfections, Baines nonetheless succeeded in outlining the contours of Indian social reality.
Acknowledging the vastness of the field, Baines admitted in his preface that a somewhat superficial treatment was unavoidable if the review was to appear before the underlying data became obsolete. No single volume could fully do justice to India’s ethnographic richness. Baines’s real achievement lies in providing a framework, a set of categories and a body of data, on which future specialists could build. In this sense, these chapters provide initial foundations for future researchers and historians.
Baines closed his Census 1891 report with an epigraph: “Nam coenae fercula nostrae Malim convivis quam placuisse coquis” (I would rather please the guests than the cooks with the courses of our feast). He tried to offer an informative and often critical, even though unpolished, account of the census’s findings and limitations.
(Authors: Gaurav Kalyani works as Research Associate at the Center for Legislative Education and Research, FLAME University, Pune;
Dr. Shivakumar Jolad works as Associate Professor (Public Policy), and is the Chair of Center for Legislative Education and Research and Director India State Stories, FLAME University, Pune
Gaurav contributed to conceptualization, research and primary writing; Shivakumar contributed to conceptualization, research and editing)
Source:
Baines, J. A. (1893). General Report on the Census of India, 1891. London.


Comments