
24 | Measuring Literacy and Colonial Education in Early 20th Century: Insights from 1911 Census of India
Updated: Jul 29
By Umesh Bedkute and Shivakumar Jolad
Published on: 27 July 2026
Introduction
The Census of India, 1911, the sixth all-India synchronous enumeration, conducted under the direction of Sir Edward Albert Gait, I.C.S., and published in Calcutta in 1913, recorded a population of over 315 million persons across British India and the Native States, from Baluchistan to Burma. Chapter VIII of Part I of the General Report (pages 291 to 324) is devoted to Education. This chapter continues the analytical tradition established by the 1901 census while introducing an important methodological refinement that would permanently alter how literacy in India was measured and compared.
This essay draws on Chapter VIII, supplemented by the detailed age, sex, religion, and caste tables assembled from the Imperial Tables of 1911, to present a comprehensive account of literacy and education in India at the close of the first decade of the twentieth century. It traces the shift that separated the 1911 census from its predecessor, examines the provincial and religious geography of literacy, explores the deep imprint of caste on educational attainment, and the statistical record within the wider debate over the pace and the limits of colonial educational policy.
"Of the total population of India, only 59 persons per mille are literate in the sense of being able to write a letter to a friend and to read his reply."
— Sir E. A. Gait, Census of India, 1911, Chapter VIII
Methodology and the New Standard of Literacy
The census enumerators of 1911 inherited a problem that had troubled every census since 1881. In that year and in 1891, the population had been divided into three classes: literate, learning, and illiterate, but this arrangement produced systematic errors: advanced students preferred to record themselves as literate rather than accept the seemingly derogatory label of "learning," while children in the earliest stages of instruction were frequently omitted from the count altogether. Sir Athelstane Baines, the Census Commissioner of 1891, recommended abandoning the threefold distinction, and from 1901 onward enumerators worked with a simple binary: a person was either literate or illiterate.
The 1901 census, however, left the precise standard of literacy to the discretion of local officers. Madras alone had prescribed a specific test, that a person be able to write a letter to a friend and read the reply. At the same time, the Central Provinces required the Upper Primary school examination or its equivalent. Elsewhere, practice varied "not only from province to province, but also from district to district, according to the idiosyncrasies of the local census staff." In 1911, this ambiguity was resolved by adopting the Madras standard for the whole of India, where enumerators were instructed to enter as literate only those "who can both read and write any language" to the standard of composing and comprehending an ordinary letter.
This single change had a profound effect on comparability. The 1911 Report was candid about the consequence: "it will appear further on that the application of this standard has made it somewhat difficult to gauge the progress of education during the decade by a comparison of the results of the present, with those of the preceding census."
Special enquiries in Assam and the United Provinces confirmed that the new test was appreciably stricter than the informal standards applied a decade earlier. In Madras, where the standard was unchanged, literacy rose by 28 per cent during the decade, whereas across the rest of India, where the standard had been tightened, the recorded increase was only 16 per cent. The Report concluded that the true rate of progress across India was probably at least 50 per cent greater than the raw figures suggested.
The State of Literacy in 1911
Of the more than 313 million persons for whom the education question was recorded, only 59 per mille, under 6 per cent, met the letter-writing standard of literacy. The gender gap remained immense: 106 males per mille could read and write, compared with just 10 females per mille, a ratio of roughly eleven literate males to every literate female.
Measure | Figure |
Overall literacy rate | 5.9% (59 per 1,000 persons) |
Male literacy rate | 10.6% (106 per 1,000 males) |
Female literacy rate | 1.0% (10 per 1,000 females) |
Ratio of literate males to literate females | approximately 11:1 |
Excluding children under 15, the proportion of literate males rose to 149 per mille and of literate females to 13 per mille. The age-specific pattern for males rose steadily, from 12 per mille at ages 0–10, to 95 at 10–15, 114 at 15–20, and 150 at 20 and over. For females, the pattern peaked earlier: literacy was highest, at 21 per mille, in the 15–20 age band, before falling to 12 per mille among women over 20, a pattern the Report attributed to the tendency of girls to forget their schooling after marriage, when there was little social encouragement to keep up reading and writing.
Provincial Geography of Literacy
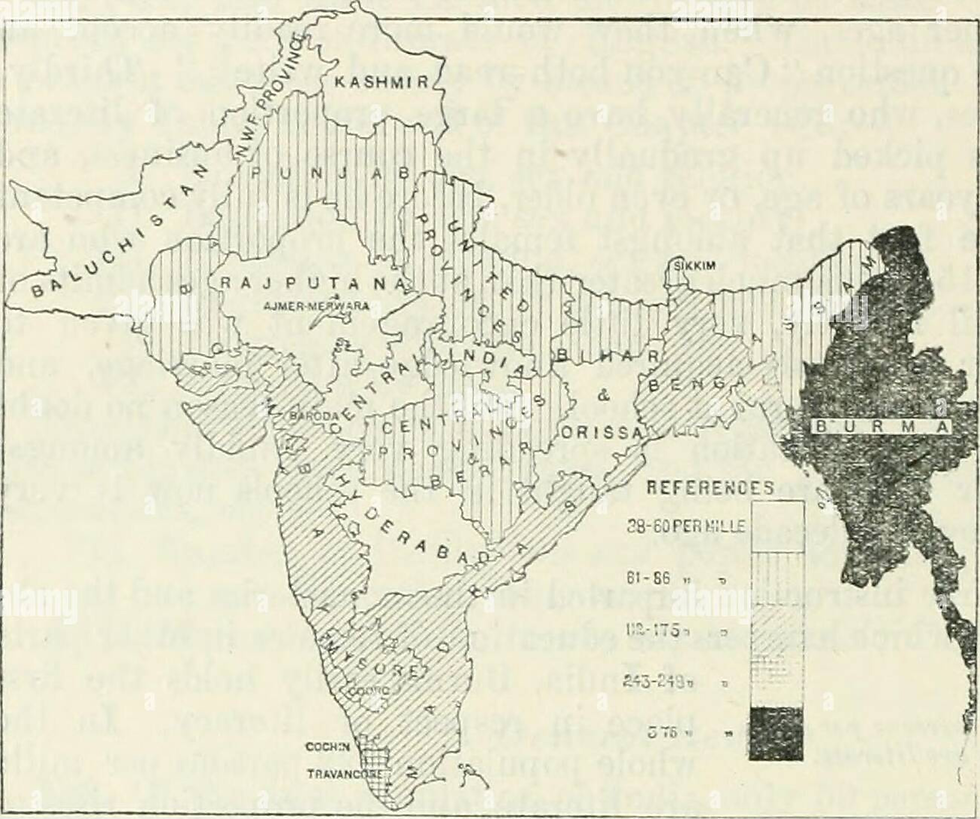
The variation between provinces remained enormous, and the underlying pattern echoed that of 1901: Burma stood far ahead of every other major province, the outcome of its dense network of free monastic schooling, while the interior provinces of northern India lagged furthest behind.
Table: Literacy by Province, 1911 (Persons per 1,000 of Total Population)
Province / State | Total literacy (per 1,000) | Notable Feature |
Burma | 222 | Buddhist monastic (kyaung) schools in almost every village |
Cochin State | 151/1000 overall (243/1000 for Males, 61/1000 for females (high female rate) | Matrilineal custom; large Christian population |
Bengal | 77 | Calcutta literacy exceptionally high |
Madras | 75 | West Coast (matrilineal areas) most advanced |
Bombay | 69 | Gujarat far ahead of Sind and Karnatak |
Assam | 47 | Tea-garden immigrant labour depresses average |
Bihar and Orissa | ~41 (Orissa 64, Chota Nagpur 28) | Sharp internal contrast between coast and plateau |
Punjab | , | Below all-India average |
United Provinces | 34 | Among the most backward British provinces |
Central Provinces and Berar | 33 | Most backward British province |
Kashmir State | 21 | Most backward tract in the Indian Empire |
Source: Gait, 1913

Native States, taken together, lagged behind the British provinces. Only 79 males and 8 females per mille were literate in the States as a whole, against 113 and 11, respectively, in British territory.
Three States: Cochin, Travancore, and Baroda, were nevertheless ahead of every British province except Burma.
Male literacy was found to be highest along the coasts and to diminish steadily inland, and it was lower in the north-west, where what the Census classified as the ‘Aryan ethnic strain’ predominated, than in the south and east, dominated by Dravidian and Mongolian populations, as classified by the Census.
The Report explained this pattern chiefly by reference to the length of time each region had been under British administration: Bengal, Madras, and Bombay, where British rule was oldest, led the field, while Baluchistan, the North-West Frontier Province, and most Native States, annexed or subordinated more recently, lagged behind.
Persistence of Female Illiteracy
Female education showed genuine, if modest, improvement during the decade, but the aggregate national picture remained one of near-total exclusion. Literacy among women followed a geography distinct from that of men. While Bengal ranked second to Burma for male literacy, both Bombay and Madras had higher female literacy rates than Bengal. The Report proposed that "the diffusion of female education varies inversely with the prevalence of the parda system," and pointed to the special influence of the matrilineal custom of tracing descent through the female line, prevalent on India's West Coast, where women occupied a comparatively higher social position.

Table: Literacy in Cities versus the General Population, 1911 (per 1,000 of each sex)
Province / State | Males (general) | Females (general) | Males (cities) | Females (cities) |
India | 106 | 10 | 303 | 91 |
Bengal | 140 | 11 | 389 | 146 |
Bombay | 120 | 14 | 283 | 99 |
Burma | 376 | 61 | 479 | 280 |
Madras | 138 | 13 | 432 | 108 |
Bihar and Orissa | 76 | 4 | 252 | 34 |
C.P. & Berar | 62 | 3 | 260 | 50 |
Punjab | 63 | 6 | 214 | 62 |
United Provinces | 61 | 5 | 198 | 41 |
Hyderabad State | 51 | 4 | 239 | 44 |
Kashmir State | 38 | 1 | 153 | 22 |
Mysore State | 112 | 13 | 354 | 118 |
Rajputana Agency | 59 | 2 | 190 | 13 |
Source: Census of India, 1911, Chapter VIII, Section 357, Subsidiary Table.
The advantage enjoyed by city-dwellers was striking throughout the subcontinent. Literate males were roughly three times as common in cities as in the general population, and literate females nine times as common, a gap the Report attributed to the concentration of schools, courts, and provincial administration in urban centres.
The effect of Christian mission activity on female education was singled out as a "secondary factor of importance" wherever it was present.
Religion and the Hierarchy of Literacy
The religious ranking of 1911 preserved the essential order recorded a decade earlier, with the Parsis at the summit of the educational hierarchy by a considerable margin.
Table: Literacy by Religious Community, All India, 1911 (per 1,000 of total, and males/females separately where noted)
Community | Overall literacy | Notes |
Parsi (Zoroastrian) | 711 per 1,000 (831 excluding under-15s) | Nearly four-fifths of males, two-thirds of females literate |
Jain | ~two in five | Half of males literate; only 4% of females, though female literacy had doubled since 1901 |
Buddhist | ~1 in 4 (25%) | Concentrated in Burma; male rate almost unchanged, female rate up from 4% to 6% |
Christian | ~22% | Indian Christians alone: 3x the Hindu rate, 4x the Muslim rate |
Sikh | ~1 in 15 (males 1 in 10, females 1 in 70) | Female rate doubled during the decade |
Hindu | Males 101 per 1,000; females 8 per 1,000 | Conceals huge internal caste variation |
Muhammadan | Males 69 per 1,000; females 4 per 1,000 | Lowest among major communities excluding Animists |
Animistic | Males 11 per 1,000; females 1 per 1,000 | Least literate community overall |
Source: Gait, 1913.

The Report drew particular attention to the case of Indian Christians. Although converts were recruited overwhelmingly from aboriginal tribes and the lowest Hindu castes, groups that were themselves almost wholly illiterate; Indian Christians as a body had, in proportion to their numbers, three times as many literate persons as Hindus and more than four times as many as Muslims.
One Indian Christian male in four, and one female in ten, could read and write. In Bihar and Orissa, the contrast was made vivid by a direct comparison that, 76 per mille of Indian Christians were literate, against only 5 per mille among their Animistic kin who had not converted.
The relatively low position of Muslims was explained largely by geography rather than any inherent educational deficiency. The bulk of India's Muslim population lived in the north-west, where all communities were comparatively backward, and in Eastern Bengal, where Muslims were mainly descended from converts among depressed local groups.
In the United Provinces, Madras, the Central Provinces and Berar, and in Bombay outside Sind, Muslims in fact equalled or surpassed Hindus in literacy, a reminder that the aggregate national figure obscured sharply divergent regional realities.
Explore the interactive data visualization on literacy rate by religion and gender below:
Caste and Learning
Table IX of the Imperial Tables, "Education by Caste, Tribe or Race," together with Subsidiary Table VI, allowed the census to trace literacy down to the level of individual jatis across every province, arguably the richest single dataset the colonial census ever produced on the social distribution of education.
Table: Literacy by Selected Caste and Province, 1911 (Literate Persons per 1,000 of Caste Population, Approximate)
Caste | Province | Approx literacy (per 1000) | Rank / Note |
Baidya | Bengal | ~532 | Highest-ranked Hindu caste in Bengal; surpasses even Brahmans |
Subarnabanik | Bengal | ~451 | Trading caste; high female literacy for a non-priestly group |
Brahman | Madras (Tamil) | ~418 | Leads the caste hierarchy in southern India |
Kayastha | United Provinces | ~325 | Scribal caste; leads UP ahead of Brahmans |
Kashmiri Pandit Brahman | Kashmir | ~325 | Far ahead of all other communities in the State |
Mahajan | Rajputana | ~229 | Mercantile caste; consistently high across Native States |
Karan | Bihar and Orissa | ~257 | Traditional Odisha writer caste |
Rajput | Bihar and Orissa | ~92 | Warrior caste; often below trading and scribal castes |
Kunbi | Central Provinces / Bombay | ~31–49 | Cultivating caste; middling literacy |
Gond | Central Provinces | ~7 | Tribal community; near-total illiteracy |
Chamar | United Provinces | ~1 | Depressed caste; virtually no literacy |
Musahar | Bihar and Orissa | ~1 | Among the most illiterate groups recorded anywhere |
Source: Census of India, 1911, Imperial Table IX; Subsidiary Table VI, Chapter VIII, Section 366.
A more detailed table is provided in the appendix below.
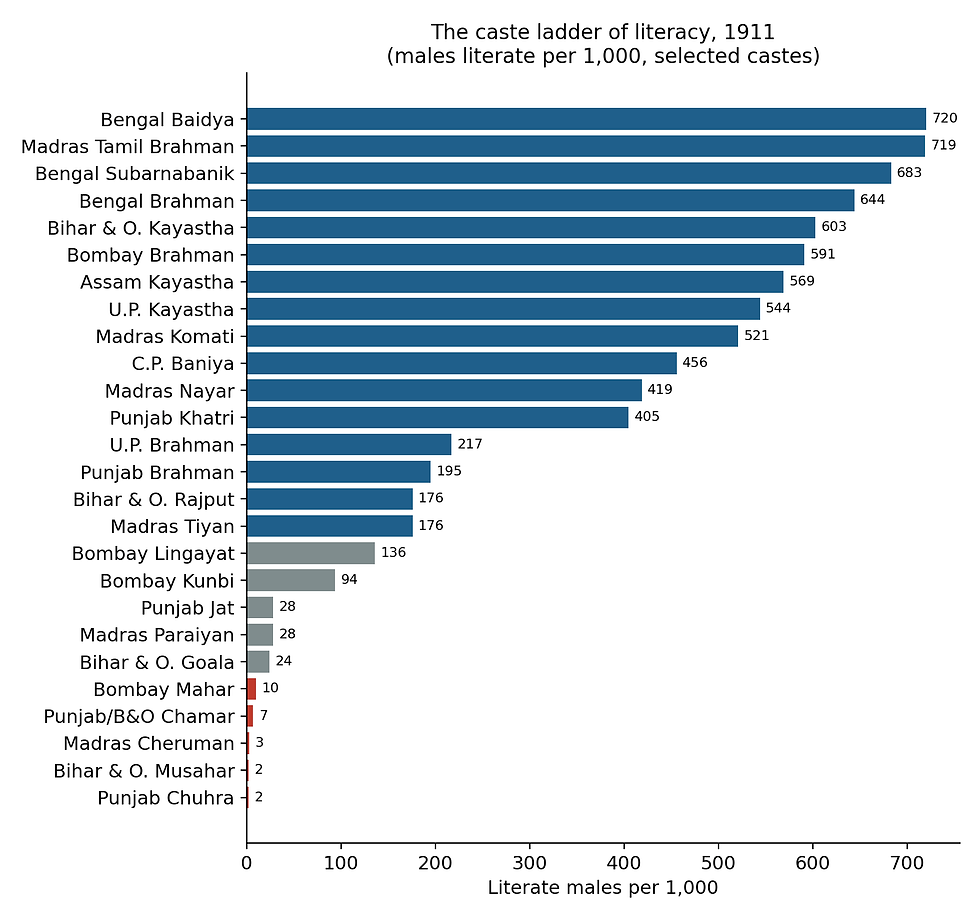
The Report's own summary of this evidence was unambiguous:
"As a rule, the high castes stand at the top, and the low castes at the bottom, but a great deal depends on their occupation."
Writer castes such as the Kayastha and Karan, and trading castes such as the Agarwal and Khatri, frequently rivalled or exceeded the Brahman, who led the field in southern India but was overtaken in Bengal by the Baidya and Subarnabanik, in the United Provinces and Bihar and Orissa by the Kayastha, and in the Punjab by the Khatri and Agarwal.
Occupation, not ritual rank alone, increasingly shaped the statistics. Certain low castes engaged in trade, such as the Teli, Shaha, Kalwar, and Pod, achieved literacy levels well above what their social position would predict, while the martial Rajputs, despite their high status, frequently trailed behind commercially active communities of far lower rank.
The Report also noted signs of change at the margins. The Paraiyans of Madras, among the most depressed castes in the presidency, had very nearly tripled their proportion of literate persons in the space of a single decade, an early statistical trace of the emerging movements for depressed-class education that would gather force in subsequent decades.
Female education among the higher castes showed a similarly uneven geography. In southern India the Brahmans generally led in female literacy, but further north, other communities, such as the Kayasthas in Bihar and Orissa and the United Provinces, and the Baidyas in Bengal led.
Explore the interactive data visualization of literacy rate by principle caste, below:
English Education
Excluding the small Brahmo community, the Parsis were, by a wide margin, the most English-literate community in India, a finding the Report characterised as "extraordinary" once it was recalled that the proportion included children. Indian Christians ranked second, though at only a tenth of the Parsi proportion; the Jains followed at a considerable distance, and then the Hindus and Sikhs, with Muslims, Buddhists, and finally the Animists, at only two persons in ten thousand.
Within the Hindu fold, English literacy was sharply concentrated among a handful of high-status, professionally oriented castes. In Bengal, nearly two-fifths of Baidya males, and about one-fifth of Brahman and Kayastha males, could read and write English; in Madras, roughly a fifth of Tamil Brahman males shared this accomplishment. Bengal led all provinces in the spread of English, followed by Bombay and Madras, while in the United Provinces and Bihar and Orissa fewer than five in a thousand could claim it.
Table: Literacy in English, All India and Selected Communities, 1911
Category | Figure |
Total persons literate in English, all India | 1.7 million |
Males literate in English (per 10,000) | 95 (0.9 %) |
Females literate in English (per 10,000) | 10 (0.1%) |
Parsis literate in English (excluding Brahmos) | 1 in 3 (half of males, one-sixth of females) |
Growth in English literacy since 1901 | +50% (similar rate for both sexes) |
Source: Census of India, 1911, Chapter VIII, Section 367.
Comparing 1911 with 1901: Progress Behind Misleading Numbers
Because the 1911 standard of literacy was stricter than what generally applied in 1901, a straightforward comparison of the two censuses understated the true rate of educational advance. The total number of literate persons nonetheless rose over the decade from 157 million to 186 million, an increase of 18 per cent. Literate males increased by 15 per cent and literate females by a striking 61 per cent. The number of literate females over the age of 15 had grown from under half a million twenty years earlier to a million and a quarter by 1911.
Progress at the critical age-band of 15–20, those who had just passed the ordinary school-going age, was regarded by the Report as the truest gauge of the effectiveness of the school system. Here, the proportion of literate males rose from 132 to 144 per mille over the decade, and of literate females from 14 to 21 per mille.
Assam, Madras, and Bengal showed the clearest gains among males; among the Native States, Cochin, Travancore, and Mysore improved most, while Hyderabad and the Central India Agency actually recorded a decline. For females, the Punjab and the United Provinces stood out, with literacy more than doubling, though the most dramatic absolute gains were recorded in Baroda, Travancore, and Cochin.
The Education Department's own figures corroborated this picture of accelerating, if still modest, expansion.
The number of scholars in all kinds of educational institutions rose from 3.7 million in 1891 to 4.4 million in 1901 and to 6.3 million by 1911.
Enrolment in secondary schools and Arts Colleges had doubled since 1891, and primary school enrolment had grown by 67 per cent, ranging from a modest 39 per cent increase in Bombay to a striking 204 per cent increase in the United Provinces.
The number of candidates passing the University Matriculation examination rose from 4,079 in 1891 to 10,512 in 1911, and the number of persons obtaining a degree in Arts, Science, Medicine, or Law rose from 1,437 to 5,373 over the same period, evidence that, whatever the ambiguities of the literacy statistics, the higher reaches of the colonial education system were expanding briskly.

Causes of Continuing Illiteracy
The Report situated the persistence of mass illiteracy within a familiar historical and structural frame, largely reiterating the diagnosis offered a decade earlier. Before British rule, it claimed,
the notion of state-sponsored popular education had been "practically unknown"; the country had for centuries been unsettled by dynastic contest, and rulers had concerned themselves with revenue and military supremacy rather than the welfare of ordinary subjects.
Under the caste system, the learned professions had long been the preserve of a narrow circle of castes, and classical law codes had explicitly forbidden the imparting of knowledge to Shudras, an exclusion whose social afterlife, the Report observed, "still survives."
Economic constraints compounded this cultural legacy. The great mass of the population, dependent on agriculture and manual labour, needed the help of their children in tending cattle and performing other domestic tasks, making the opportunity cost of schooling prohibitive even where fees were nominal. And despite gradual improvement in many parts of India, low-caste children remained unwelcome in village schools; where admitted at all, they were commonly made to sit apart in the verandah rather than inside the schoolroom with their higher-caste classmates.
The Report noted that efforts had begun, in recent years, to offer special facilities for the education of the depressed classes, an acknowledgement, however understated, of the systemic exclusion that the caste tables so starkly illustrated.
Conclusion
The Census of India, 1911 offers a portrait of a society only very gradually emerging from near-universal illiteracy. Its progress was obscured, ironically, by the very refinement in measurement that made the 1911 statistics more precise than any that had come before. Fifty-nine persons in a thousand could read and write by the exacting new standard of composing a letter and comprehending its reply, a modest figure that nonetheless represented real, if uneven, advance once the stricter yardstick is taken into account.
The geography of literacy in 1911 preserved the essential contours first mapped in 1901: Burma's monastic schools continued to set it apart from every other major province; while the coastal presidencies of Bengal, Madras, and Bombay, longest under British administration, retained their lead over the interior. Kashmir remained the most educationally backward tract in the Empire.
Gender inequality remained the single most persistent feature of the data, even as female literacy grew at a faster proportional rate than male literacy for the second census running. This evidence of change was real but still confined to a tiny fraction of Indian women.
The religious and caste hierarchies of literacy likewise persisted with only incremental change. Parsis and Jains at the summit, Hindus and Muslims in the broad middle ranks (with substantial internal variation by caste and region), and Animist and depressed-caste communities at the foot of the table, their exclusion sustained as much by continuing social prejudice as by economic necessity.
Yet the caste tables of 1911 also contain the first faint statistical signs of change from below, most vividly in the near-tripling of literacy among the Paraiyans of Madras, hinting at the social and political mobilisations around education that would gather momentum in the decades to come.
Read together with the 1901 report, the education chapter of the 1911 census stands as a mid-point record in a long and uneven transition. A colonial state gradually, if grudgingly, expanding its educational footprint, a society still deeply stratified along the lines of caste, religion, and gender, and a statistical apparatus growing steadily more rigorous in its attempt to measure a phenomenon whose social roots ran far deeper than any school-building programme could, on its own, hope to reach.
(Authors: Umesh Bedkute is a an independent researcher, data analyst and data journalist working at the intersection of policy, education and governance.
Dr. Shivakumar Jolad works as Associate Professor (Public Policy), and is the Chair of Center for Legislative Education and Research and Director India State Stories, FLAME University, Pune
Umesh contributed to research and primary writing; Shivakumar contributed to conceptualization, research and editing)
Sources:
1. Gait, E. A. (1913). Census of India, 1911. Volume I — India. Part I: Report. Chapter VIII, Education, pp. 291–324. Office of the Superintendent of Government Printing, India, Calcutta.
2. Census of India, 1911. Volume I — India. Part II: Imperial Tables VIII and IX, and Subsidiary Tables I–VIII (Education). Office of the Superintendent of Government Printing, India, Calcutta.
Appendix
Table: Education by selected castes, tribes and races, 1911.
Proportions computed from the absolute figures of Imperial Table IX (Census of India 1911, Vol. I, Part II, Table IX, pp. 82–90).
Castes are ordered within each province by literacy, following the Table's own 'order of merit'. Provincial figures include attached States except Bombay (British territory only) and Madras (excluding Cochin and Travancore).
Province | Caste / community | Literate per 1,000 (persons) | Literate per 1,000 (males) | Literate per 1,000 (females) | English-literate per 10,000 (persons) |
Bengal | Baidya | 532 | 720 | 346 | 2,088 |
Bengal | Subarnabanik | 451 | 683 | 163 | 2,187 |
Bengal | Brahman | 399 | 644 | 113 | 1,090 |
Bengal | Kayastha | 347 | 569 | 115 | 980 |
Bengal | Kaibartta (Chasi) | 108 | 208 | 8 | 72 |
Bihar & Orissa | Kayastha | 332 | 603 | 56 | 551 |
Bihar & Orissa | Karan | 257 | 492 | 37 | 197 |
Bihar & Orissa | Brahman | 168 | 317 | 18 | 81 |
Bihar & Orissa | Babhan | 102 | 187 | 14 | 16 |
Bihar & Orissa | Rajput | 92 | 176 | 6 | 23 |
Bihar & Orissa | Goala (Ahir) | 12 | 24 | 0.8 | 2 |
Bihar & Orissa | Chamar | 3 | 7 | 0.3 | 0.4 |
Bihar & Orissa | Musahar | 1 | 2 | 0.2 | 0.3 |
United Provinces | Kayastha | 325 | 544 | 78 | 429 |
United Provinces | Agarwal | 243 | 412 | 30 | 191 |
United Provinces | Saiyid | 161 | 277 | 36 | 193 |
United Provinces | Brahman | 119 | 217 | 10 | 44 |
United Provinces | Rajput | 61 | 108 | 7 | 17 |
United Provinces | Chamar | 1 | 2 | 0.2 | 0.4 |
Punjab | Khatri | 250 | 405 | 60 | 446 |
Punjab | Agarwal | 212 | 381 | 13 | 117 |
Punjab | Arora | 210 | 367 | 28 | 123 |
Punjab | Brahman | 113 | 195 | 12 | 114 |
Punjab | Jat | 17 | 28 | 2 | 10 |
Punjab | Chamar | 4 | 7 | 0.2 | 0.4 |
Punjab | Chuhra | 1 | 2 | 0.2 | 0.6 |
Bombay | Brahman | 344 | 591 | 75 | 622 |
Bombay | Lohana | 207 | 360 | 24 | 181 |
Bombay | Lingayat | 71 | 136 | 4 | 15 |
Bombay | Kunbi | 49 | 94 | 5 | 13 |
Bombay | Maratha | 24 | 46 | 2 | 11 |
Bombay | Mahar / Holiya / Dhed | 5 | 10 | 0.3 | 0.5 |
Bombay | Bhil | 1 | 2 | 0.1 | 0.3 |
Madras | Brahman (Tamil) | 418 | 719 | 120 | 1,121 |
Madras | Brahman (Telugu) | 389 | 682 | 99 | 744 |
Madras | Komati | 274 | 521 | 25 | 76 |
Madras | Nayar | 261 | 419 | 114 | 148 |
Madras | Vellala | 130 | 246 | 18 | 106 |
Madras | Tiyan | 99 | 176 | 23 | 51 |
Madras | Paraiyan | 14 | 28 | 1.3 | 8 |
Madras | Cheruman | 2 | 3 | 0.4 | 0.1 |
C.P. & Berar | Baniya | 245 | 456 | 19 | 80 |
C.P. & Berar | Brahman | 242 | 431 | 26 | 364 |
C.P. & Berar | Rajput | 63 | 121 | 4 | 33 |
C.P. & Berar | Kunbi | 31 | 61 | 0.6 | 7 |
C.P. & Berar | Mahar | 9 | 17 | 0.3 | 2 |
C.P. & Berar | Gond | 3 | 6 | 0.1 | 0.4 |
C.P. & Berar | Chamar | 2 | 5 | 0.1 | 0.4 |
Assam | Kayastha | 360 | 569 | 118 | 839 |
Assam | Brahman | 324 | 546 | 54 | 489 |
Assam | Kalita | 79 | 147 | 5 | 81 |
Burma | Chinese | 271 | 320 | 111 | 183 |
Burma | Talaing | 221 | 366 | 78 | 19 |
Burma | Karen | 126 | 191 | 62 | 47 |
Burma | Shan | 101 | 181 | 22 | 1 |
Burma | Kachin | 9 | 12 | 6 | 0.9 |


Comments